01
Hazard Zone Maps
A hazard zone map (HZM) serves to represent significant hydrogeological hazards (avalanches, rockfalls, floods, mass movements) in a spatial context, with the aim of informing and raising awareness among the population and restricting construction projects in particularly vulnerable areas. Hazard maps play a crucial role in spatial planning and therefore represent a key component of risk management.
Different territories apply varying approaches and definitions. However, there are notable commonalities in the parameters used to define hazard zones. In countries such as Italy and Austria, key factors typically include the intensity and return period of an event.
Intensity
To assess the destructive potential of avalanches, intensity values are calculated using avalanche models (e.g., AvaFrame, RAMMS, Weezard etc.). These models allow key parameters – such as impact pressure (in kPa) at specific locations or along defined boundaries – to be determined. Based on these values, the potential damage caused by an avalanche can be evaluated.
Return Period (Frequency)
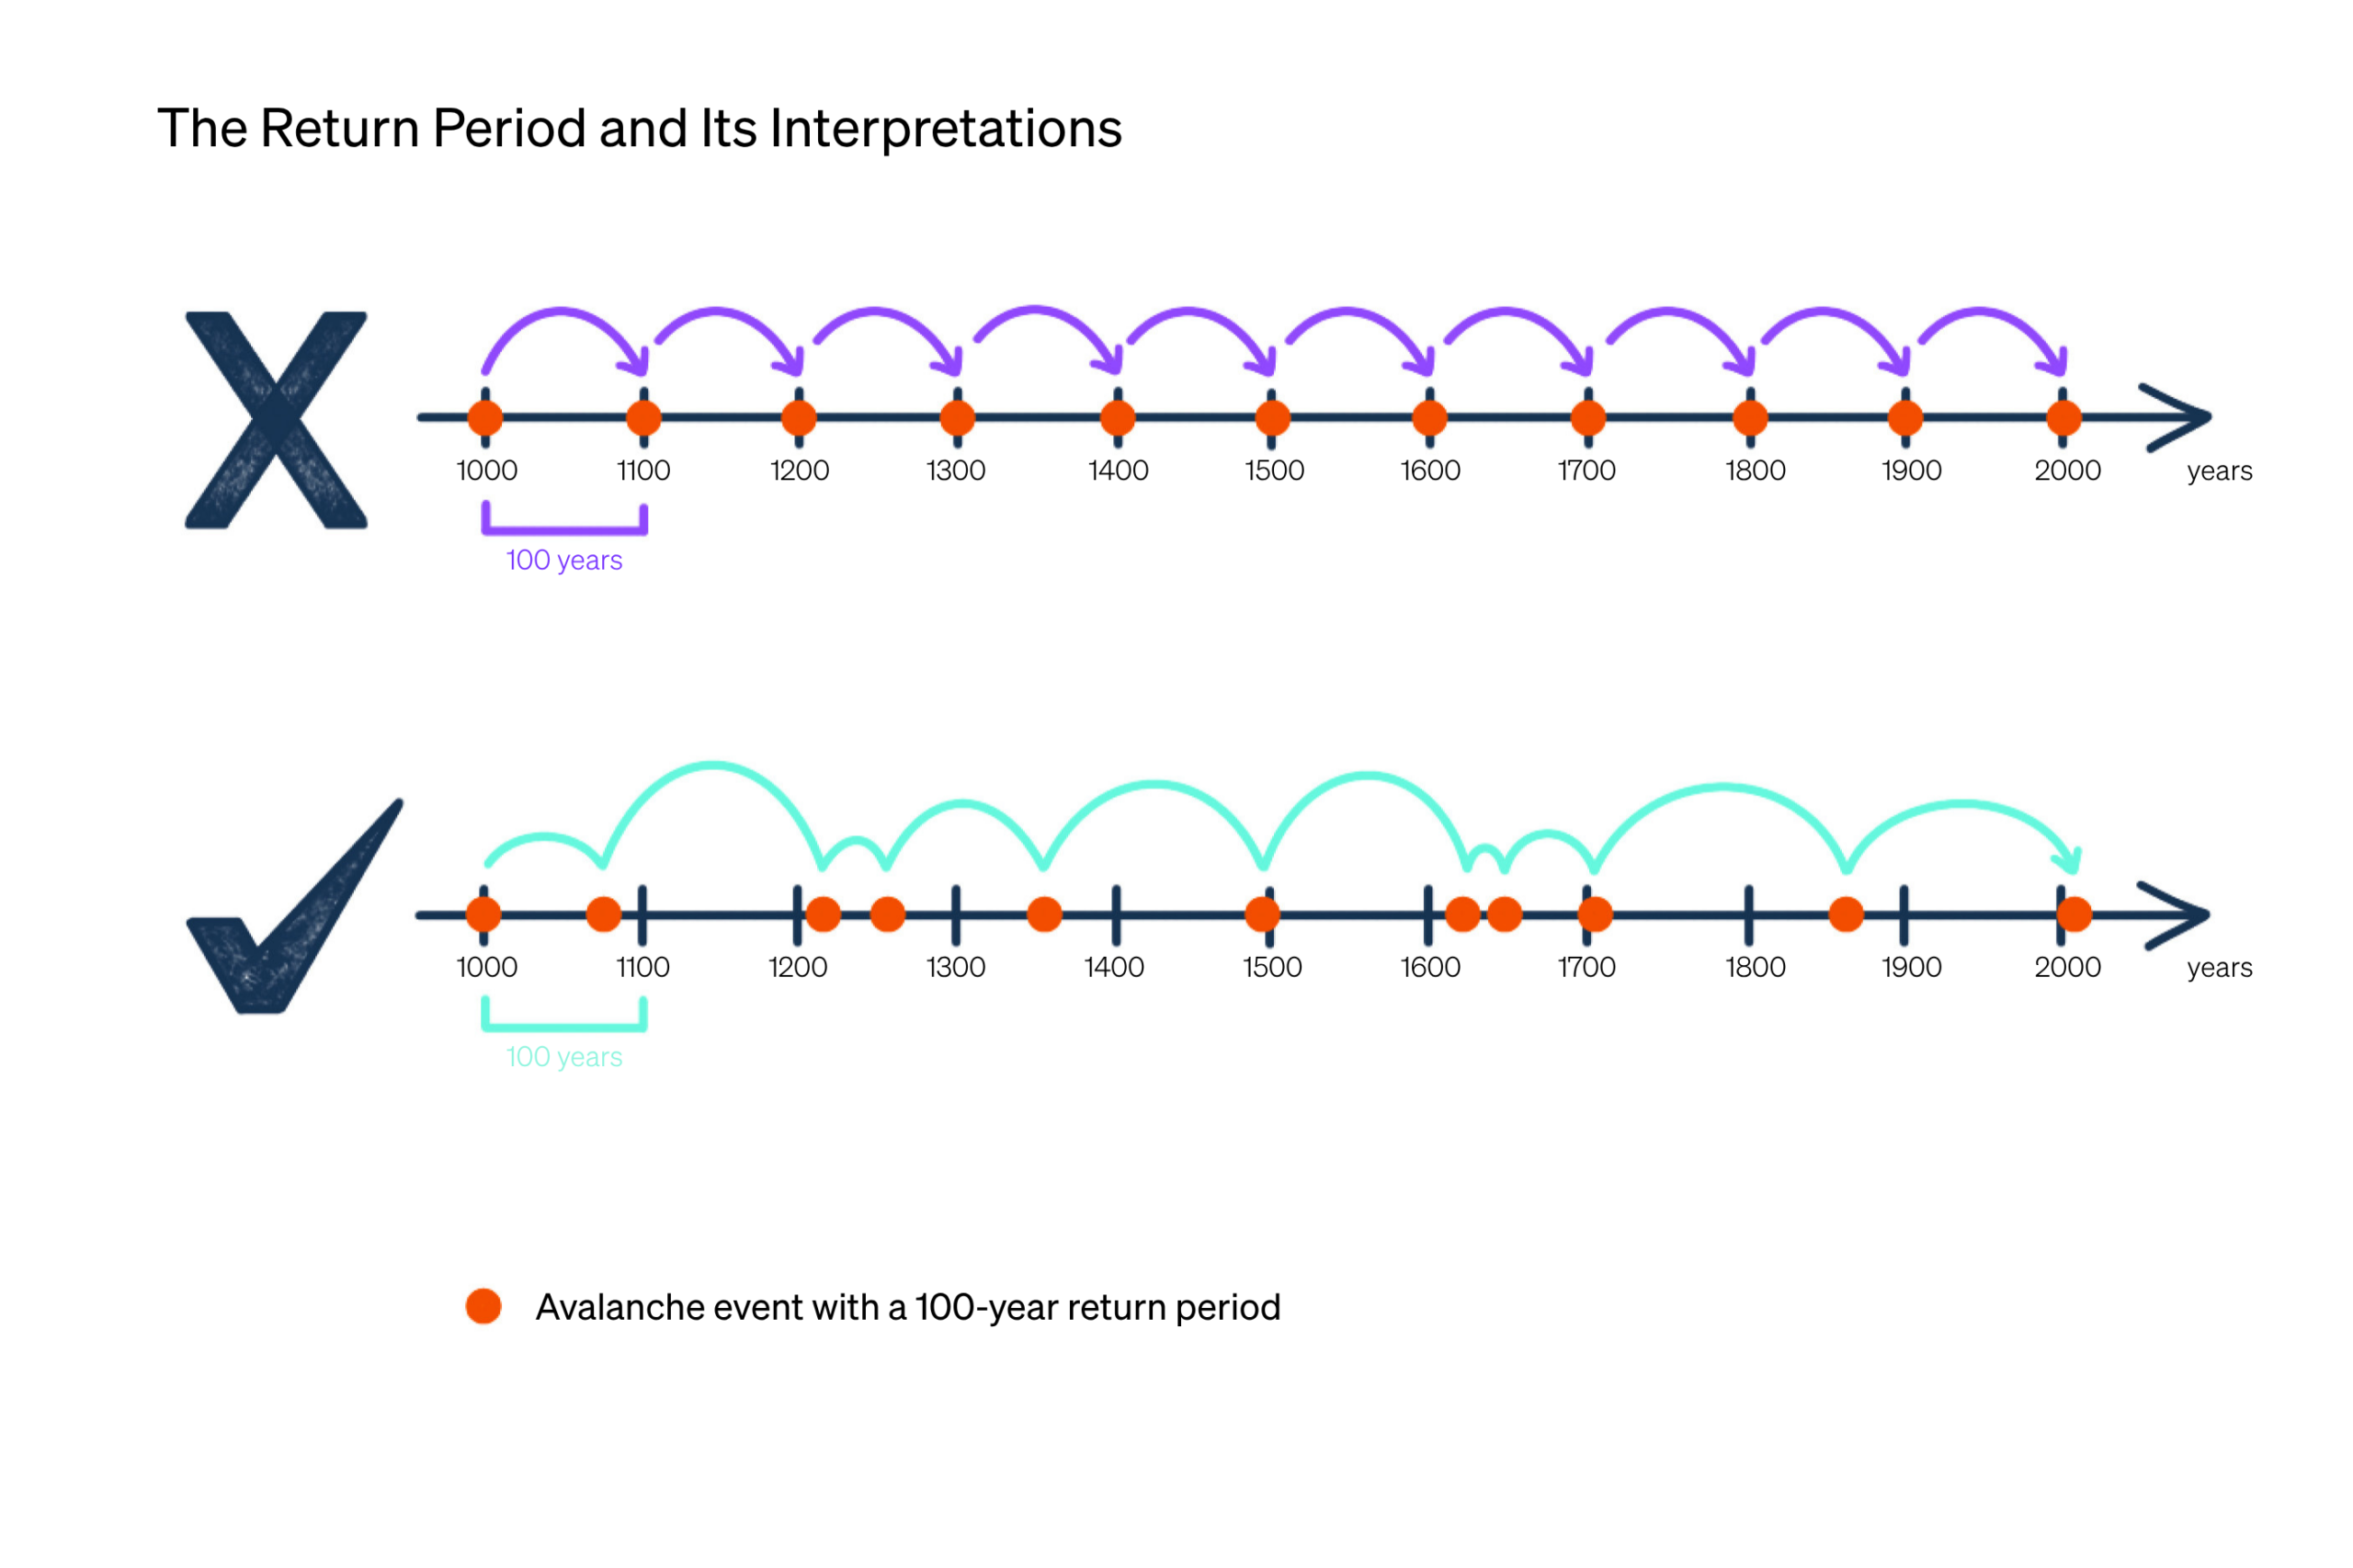
The return period is a statistical concept that expresses the annual probability of a natural event of a given intensity occurring. It is often misinterpreted as indicating a fixed cycle (e.g., “once every 100 years”), which can create a false sense of safety after such an event has occurred. In reality, the return period does not represent a prediction, but rather a probability-based measure of frequency that is independent of past events.
In practice, the return period represents the average time interval (expressed in years) within which an event of a certain intensity is expected to be equaled or exceeded once. It does not, however, describe a fixed or exact interval between two similar events. For HZM, this statistical concept is based on a defined snowfall intensity. In this context, snowfall intensity is expressed as the 3-day snowfall depth (Salm et al. 1990), meaning the maximum snow depth statistically expected within a period of 72 hours. Values are typically derived for return periods of 30, 100, or 300 years. This design snowfall is then assigned to the respective release area as the release thickness, forming the basis for modeling avalanche events with a defined annual probability.
The illustration shown here presents both an incorrect (top) and a correct (bottom) interpretation of the return period concept. Over a hypothetical time span of 1,000-years, 11 events occur. However, their occurrence is irregularly distributed, even though the average frequency corresponds to 11 events per 1,000 years. This demonstrates that the return periods represent statistical averages rather than fixed or predictable intervals between events.
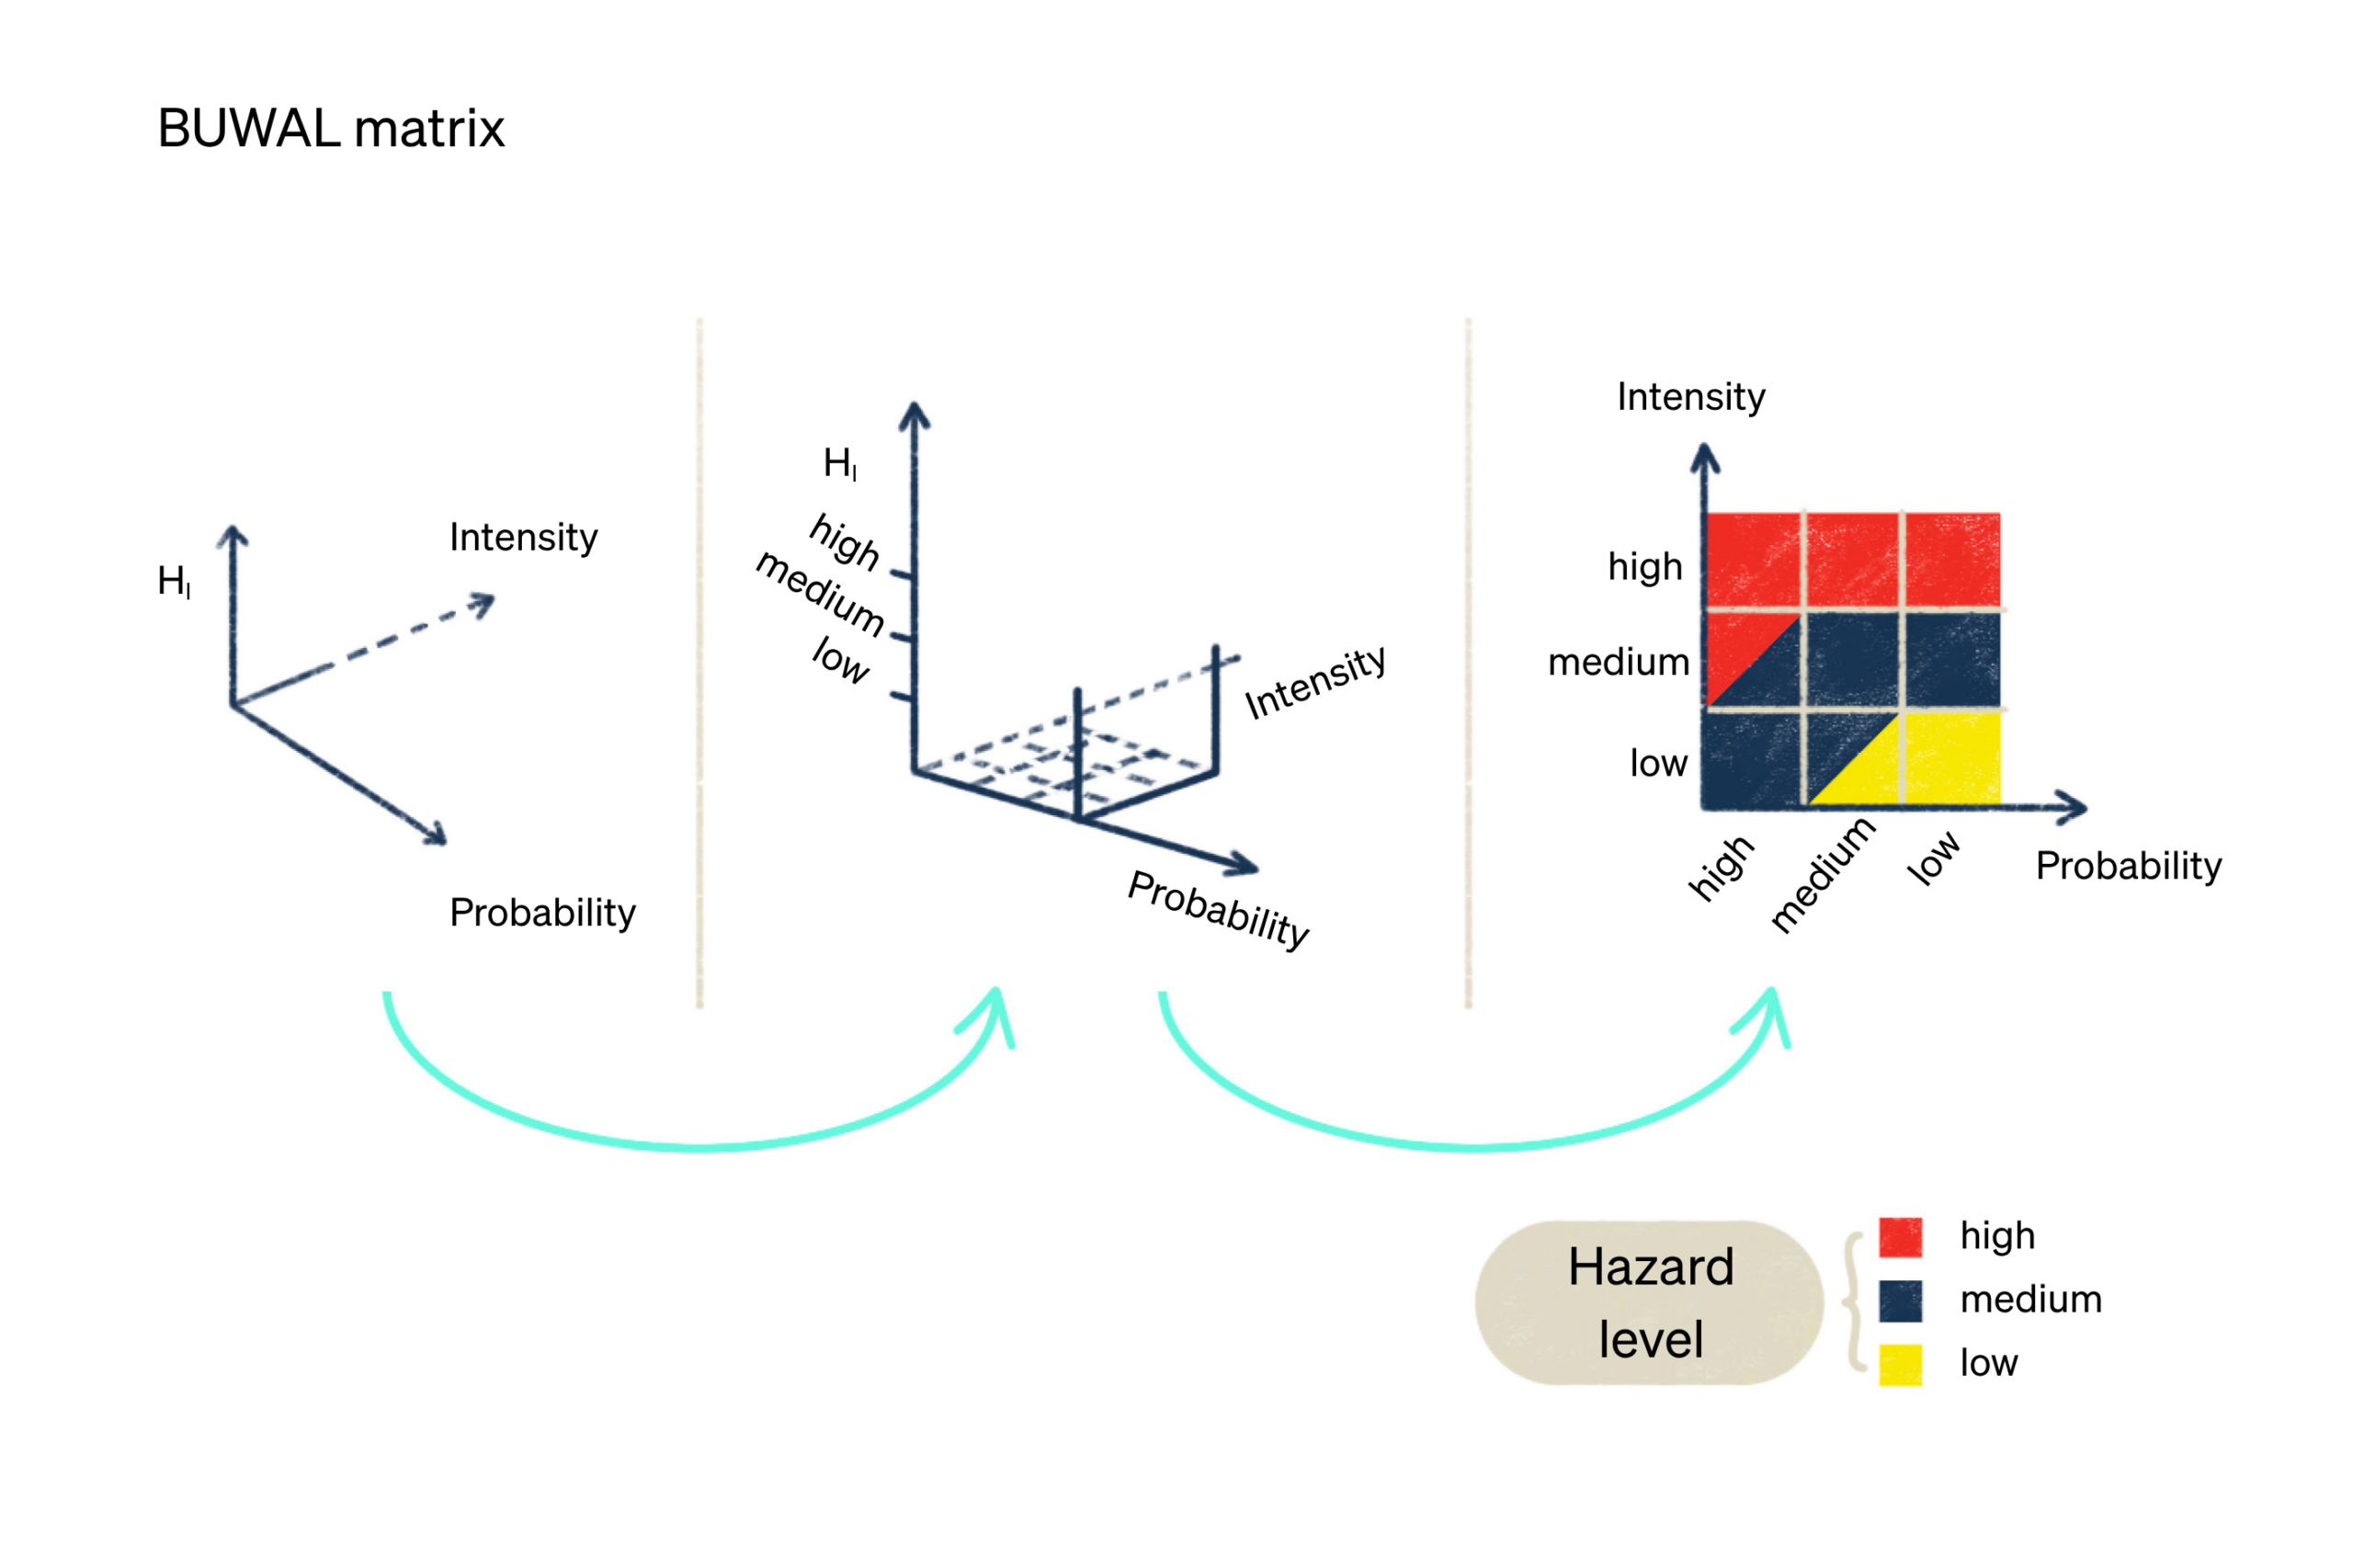
To correlate the intensity and probability of an event in order to determine the level of hazard, Swiss matrices originally developed by the BUWAL (BUWAL, 1998) are widely used, such as in Trentino and South Tyrol.
These BUWAL matrices define hazard by combining two parameters:
- Probability of occurrence (frequency): typically expressed in three classes (high, medium, and low) as a function of the event’s return period (Tr).
- Intensity of the phenomenon (magnitude): also classified into three levels (high, medium, and low) based on physical parameters such as the pressure or velocity generated by the phenomenon.
The combination of intensity and probability within the matrix allows for the definition of hazard classes (zoning):
- High hazard (red hazard zone)
- Medium hazard (blue hazard zone)
- Low hazard (yellow hazard zone)
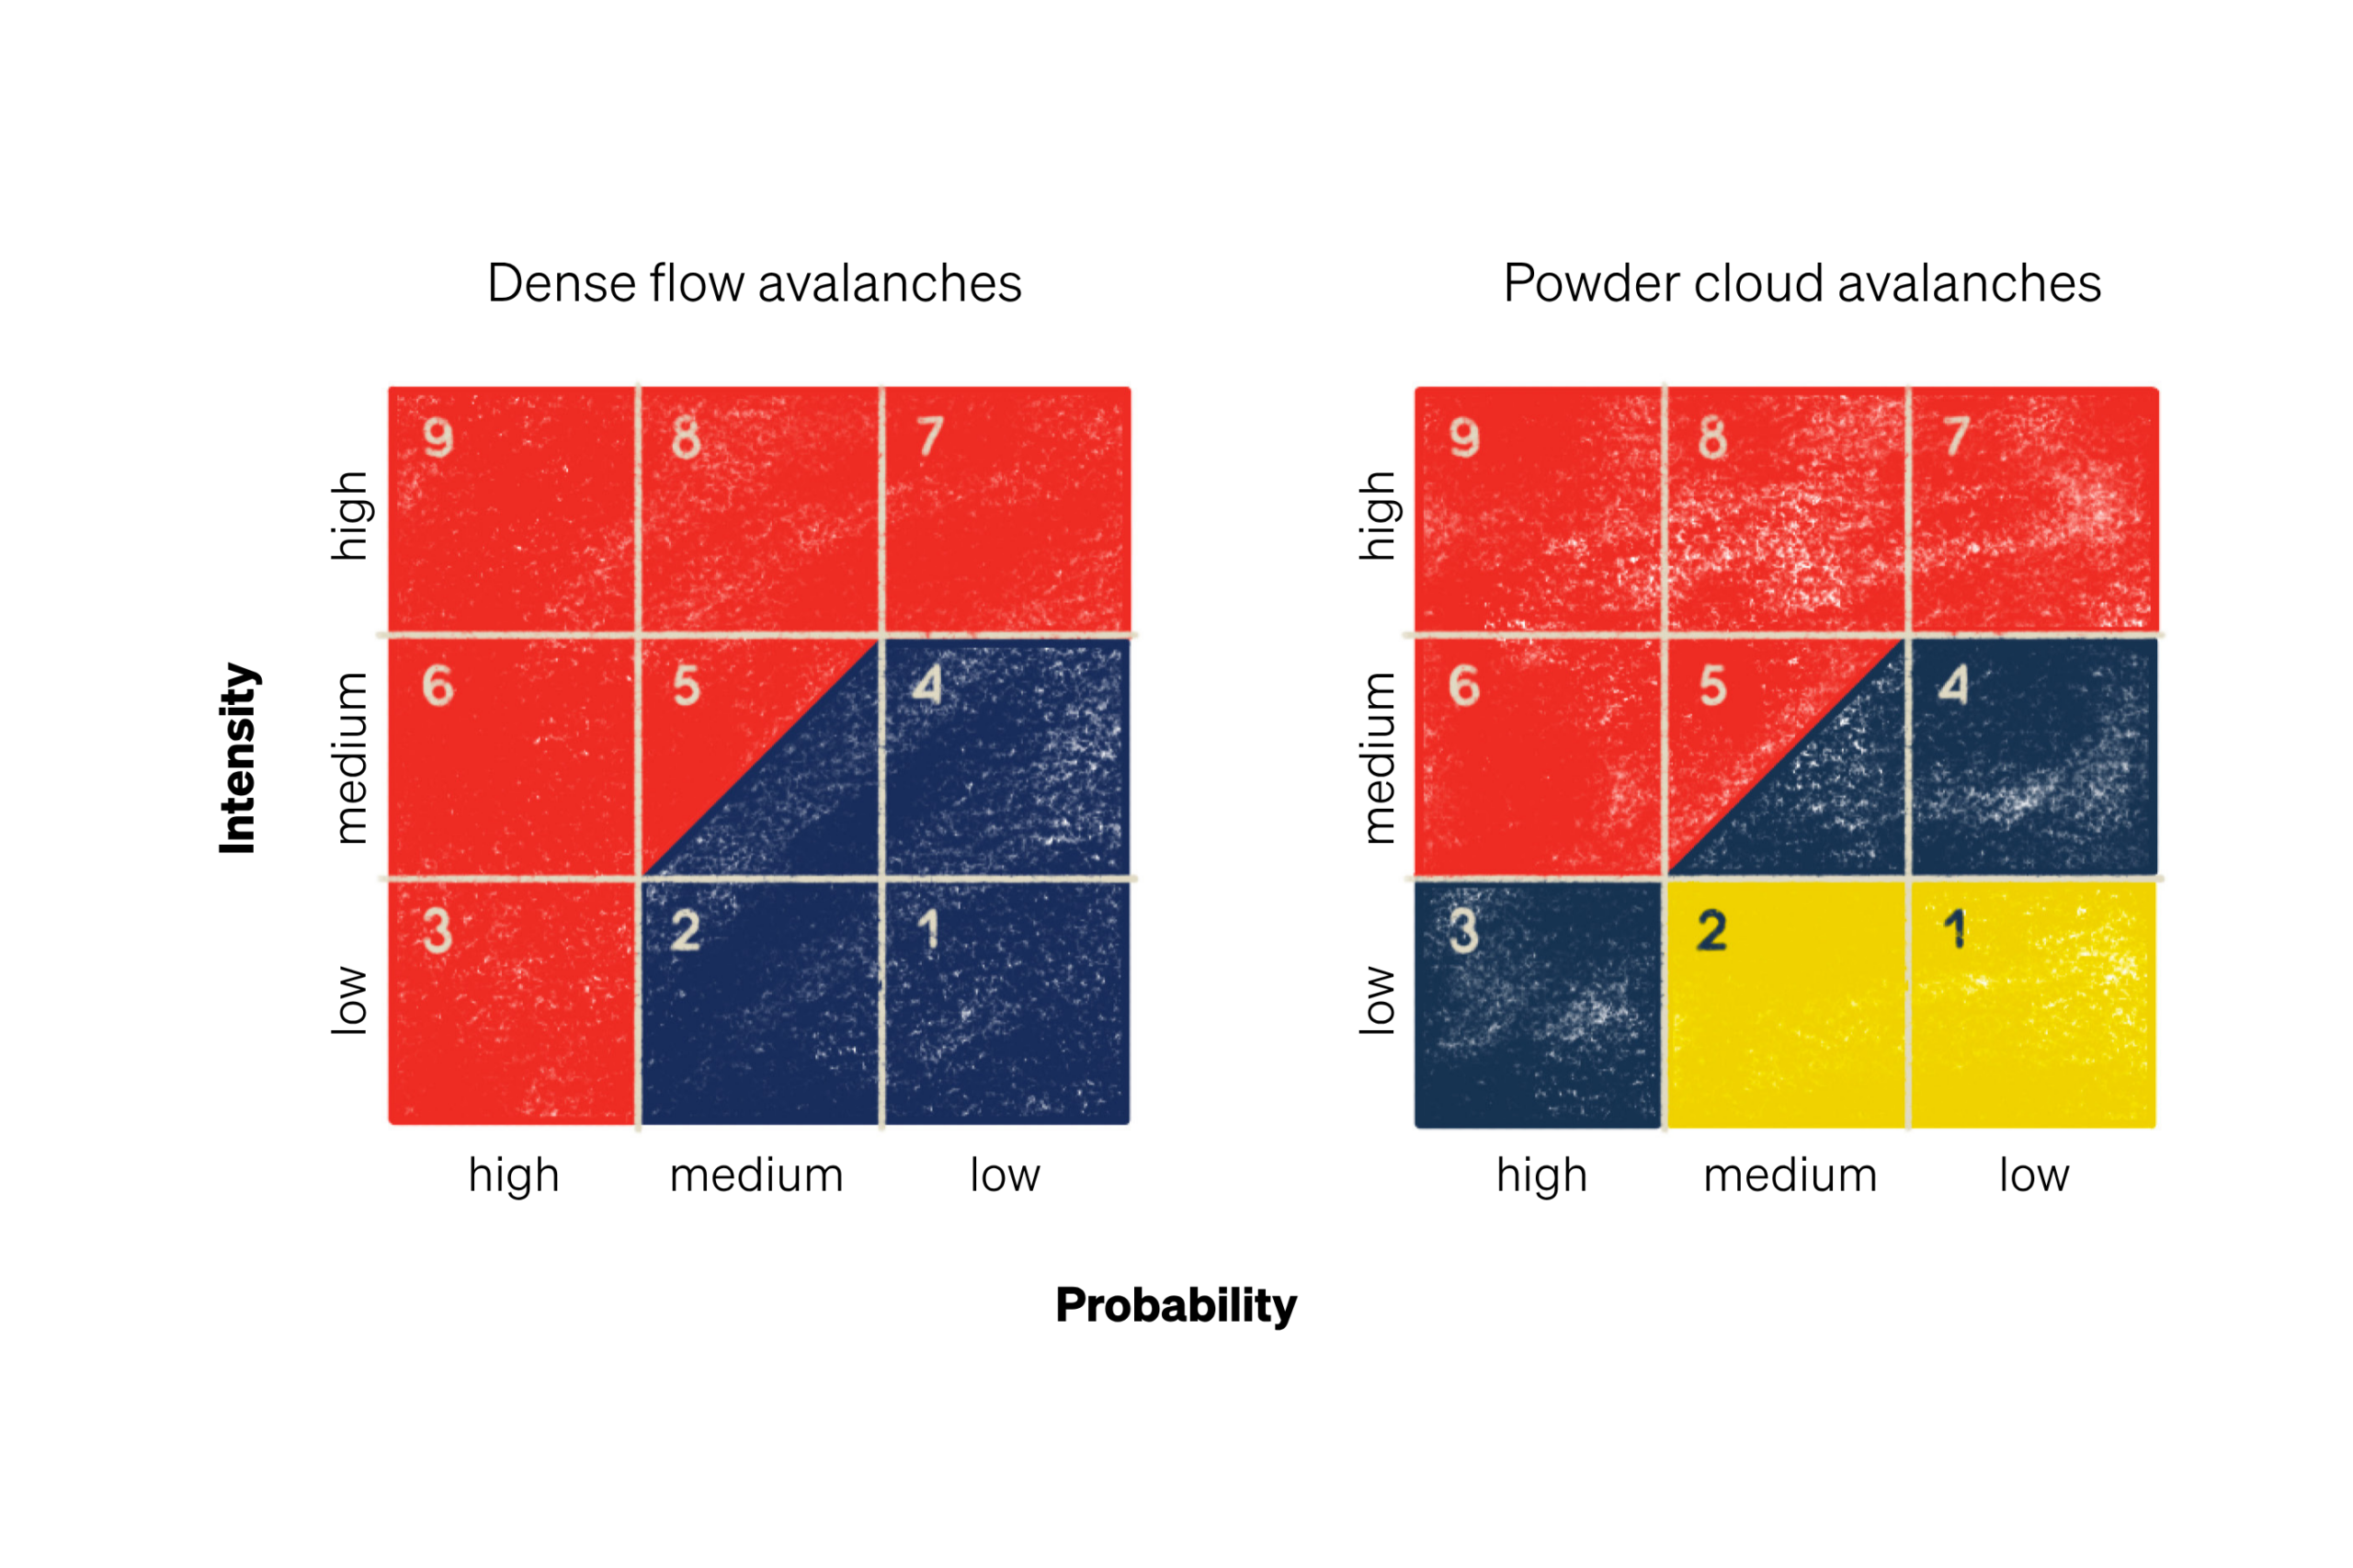
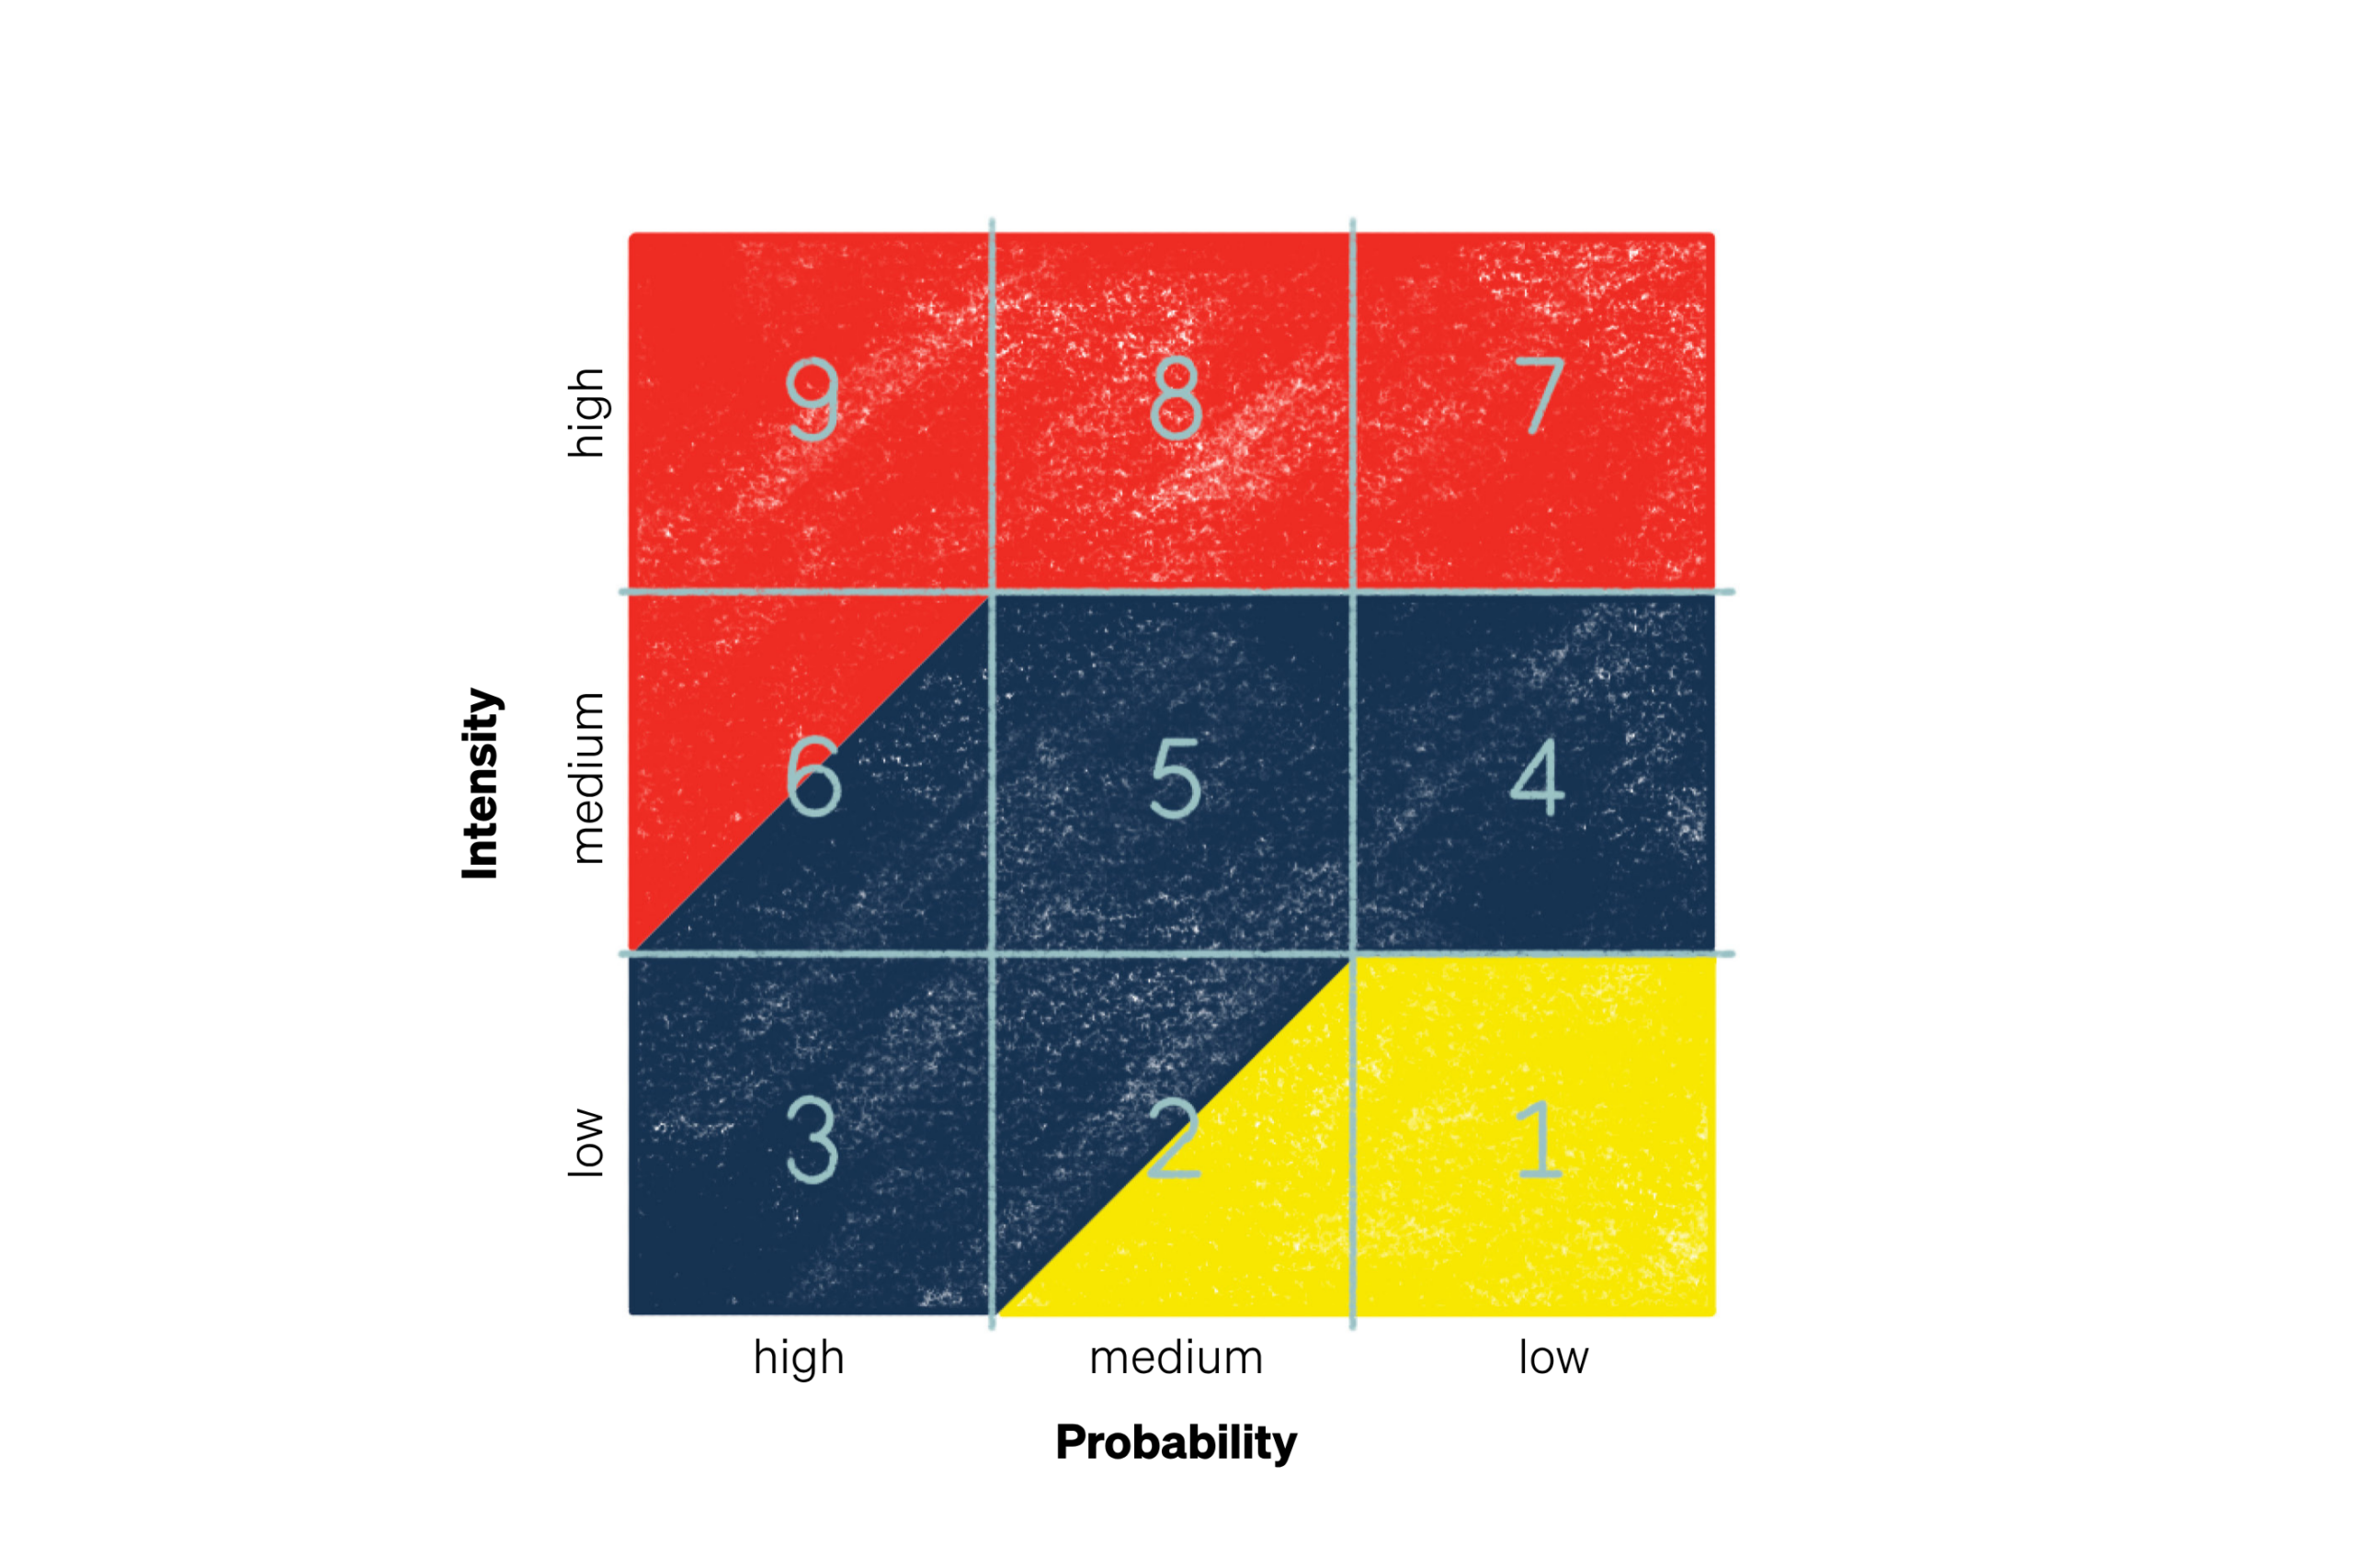
The BUWAL method is widely used to assess hazards related to hydrogeological events. However, it has been adapted by different regions to suit local requirements, resulting in variations in parameters used to define the classes (e.g., return period thresholds) as well as in the color coding assigned to the sectors – or parts of sectors – within the matrix.
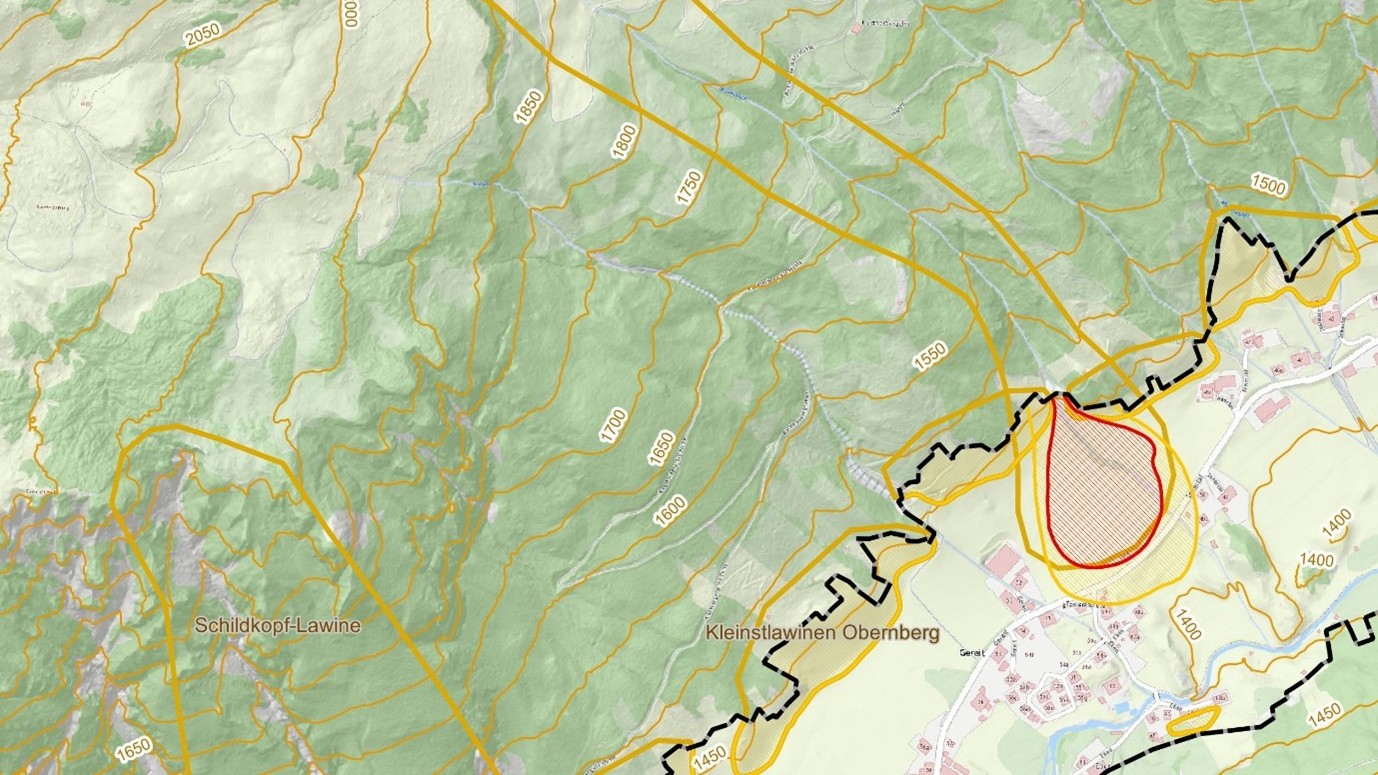
In Austria, the respective torrent and avalanche control (WLV) departments are responsible for preparing hazard zone maps for avalanches, based on their own criteria.
The hazard zones are defined as followed:
Red Zone (LR): The hazard posed by avalanches is so high that permanent settlement is either impossible or only feasible with disproportionate effort.
Yellow Zone (LG): Permanent use for settlement and transportation purposes is limited. Construction is only permitted under certain conditions and with specific requirements.
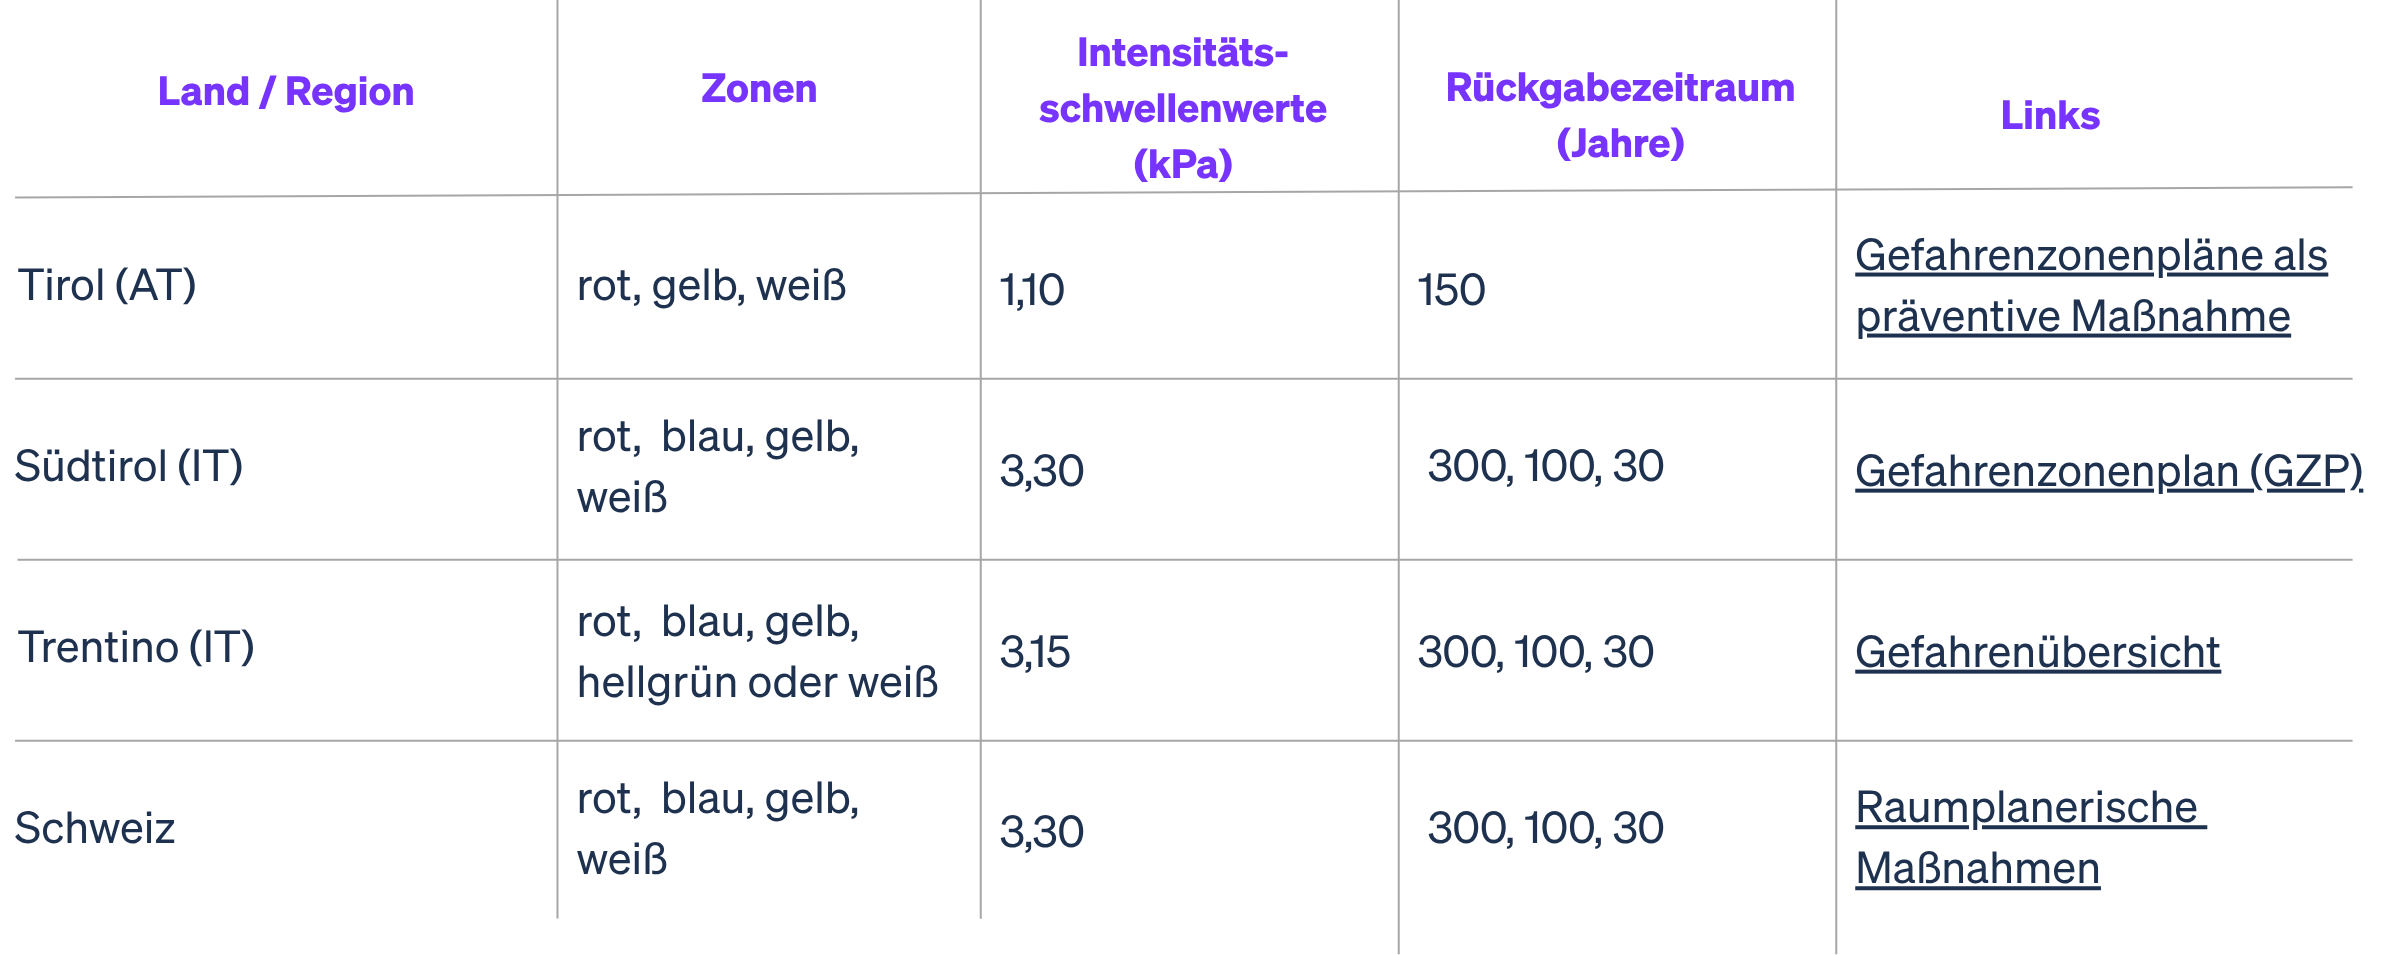
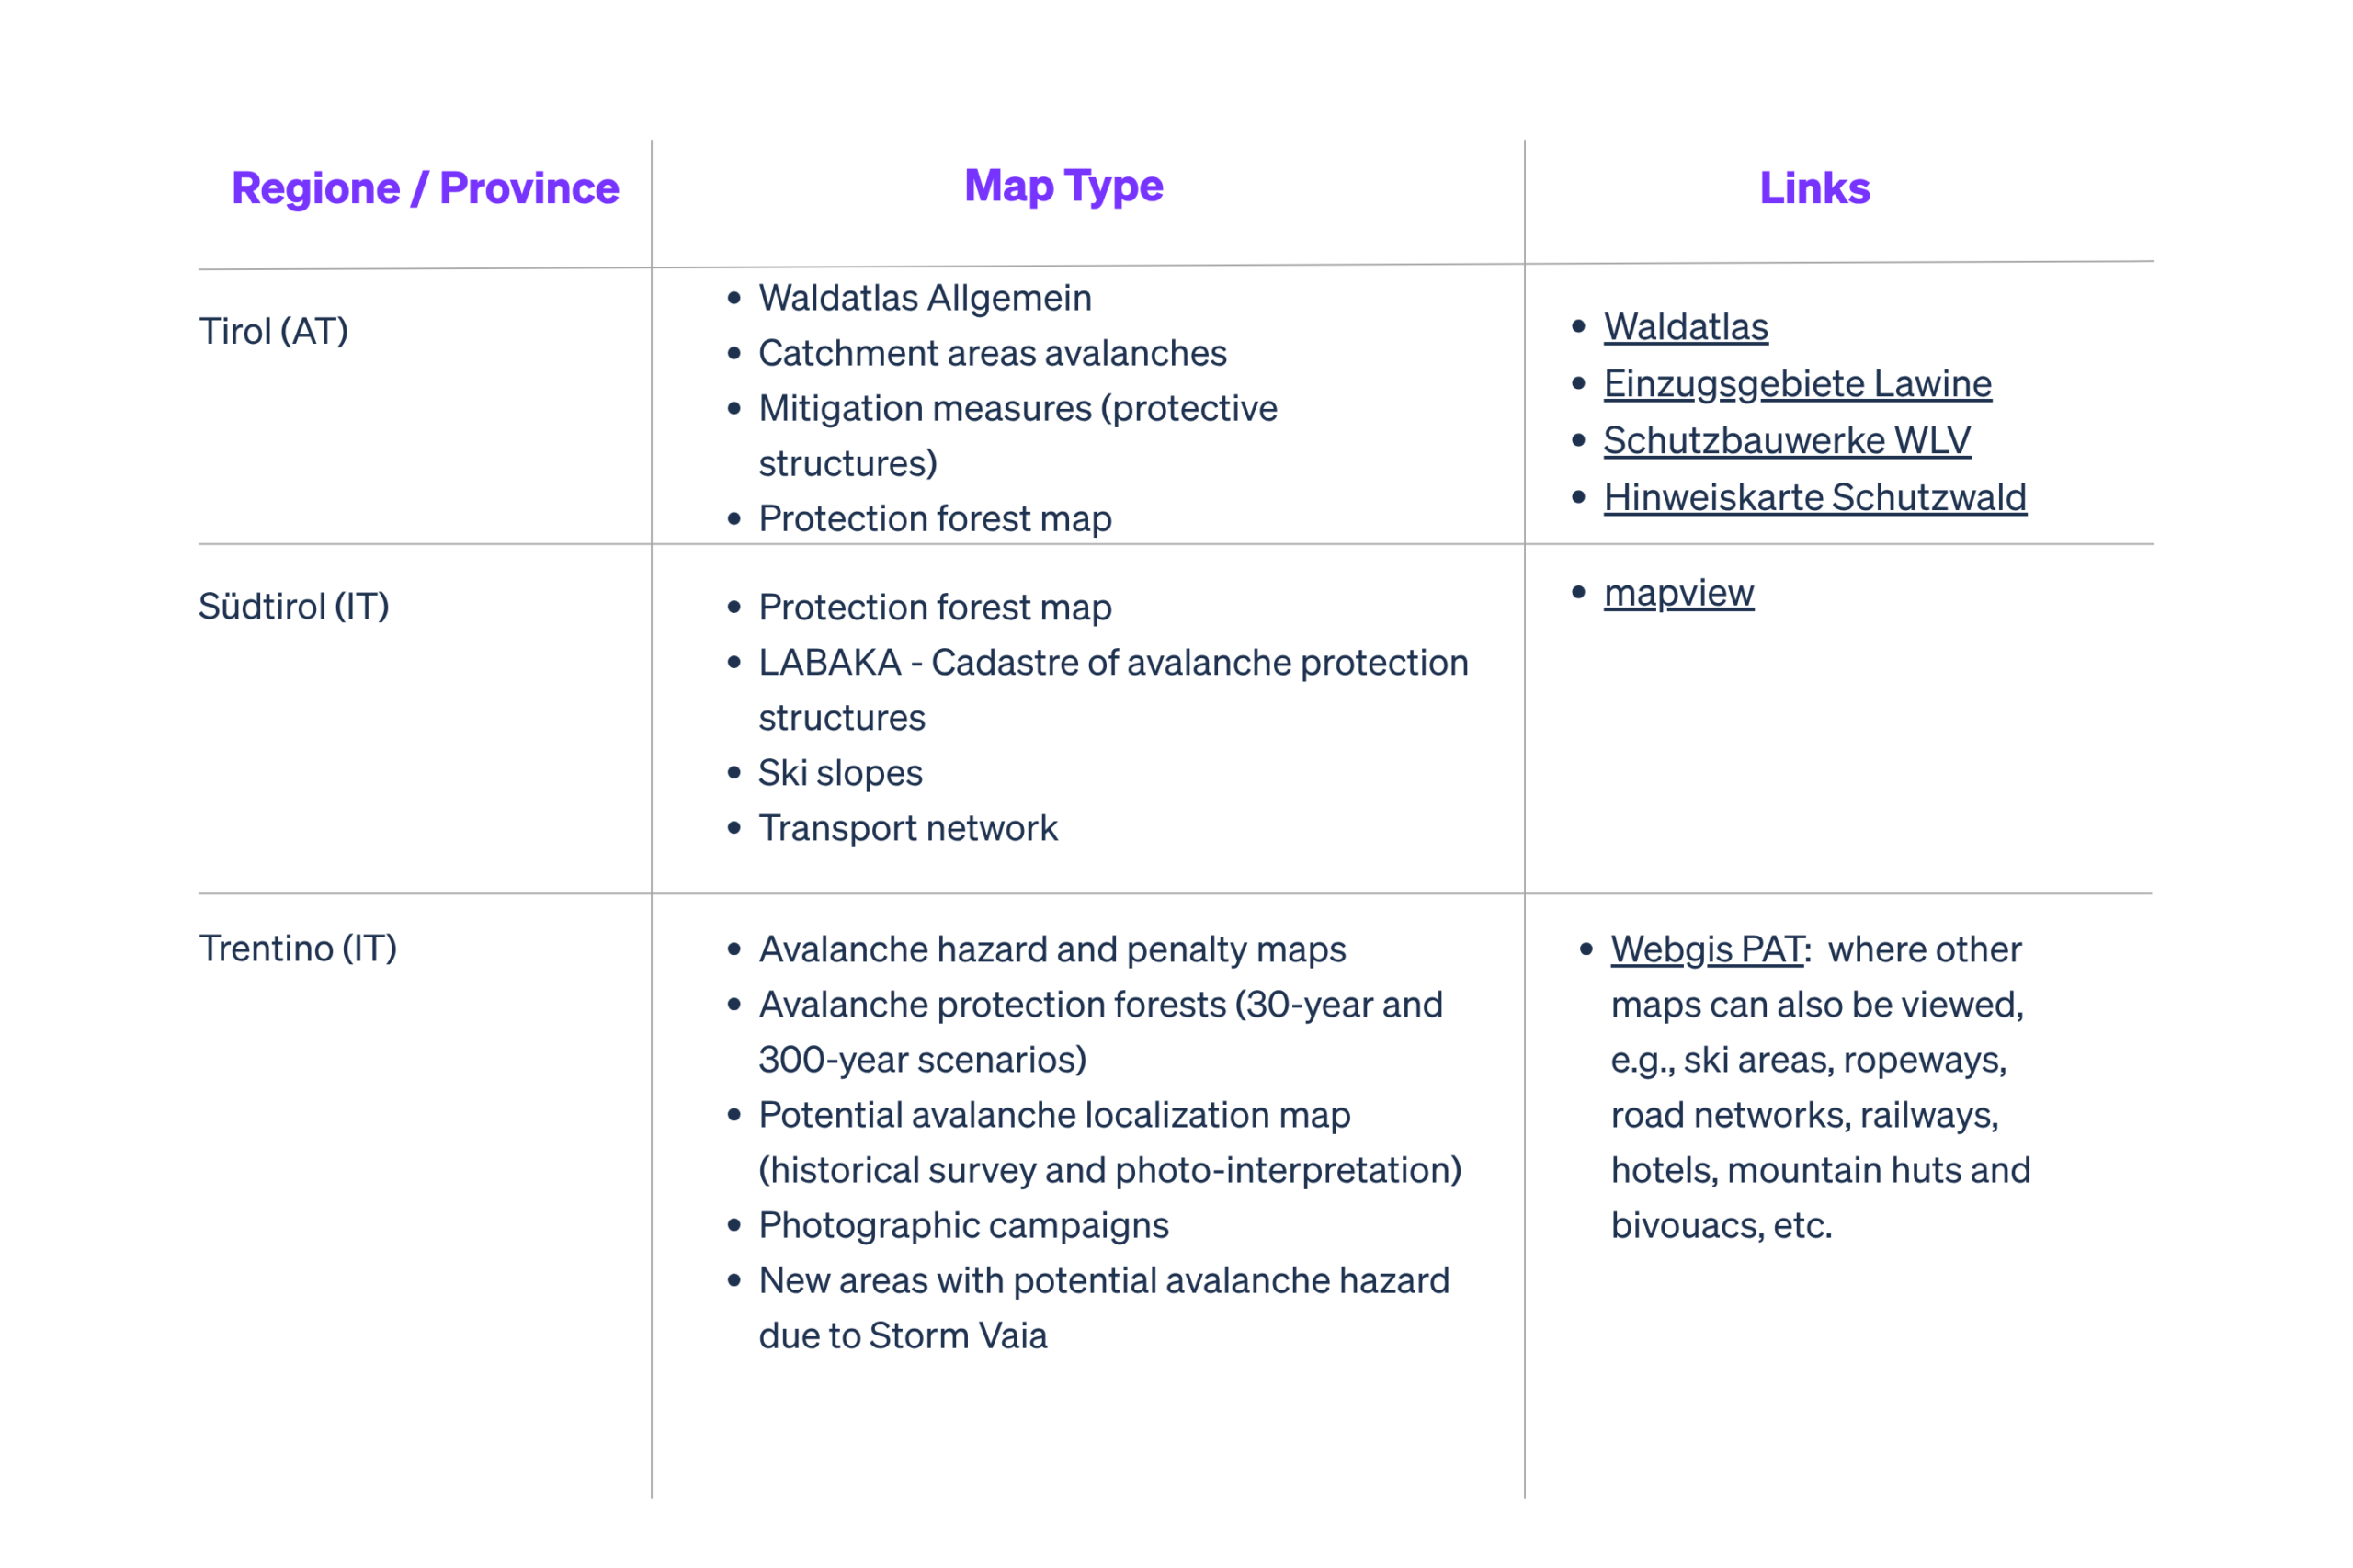
The table below summarizes the different intensities, return periods, and corresponding hazard zones adopted in the regions of Tyrol, South Tyrol, and Trentino, as well as in other countries such as Switzerland. For further information on the hazard zone planning in Tyrol, South Tyrol, and Trentino, please refer to the websites indicated in the table.
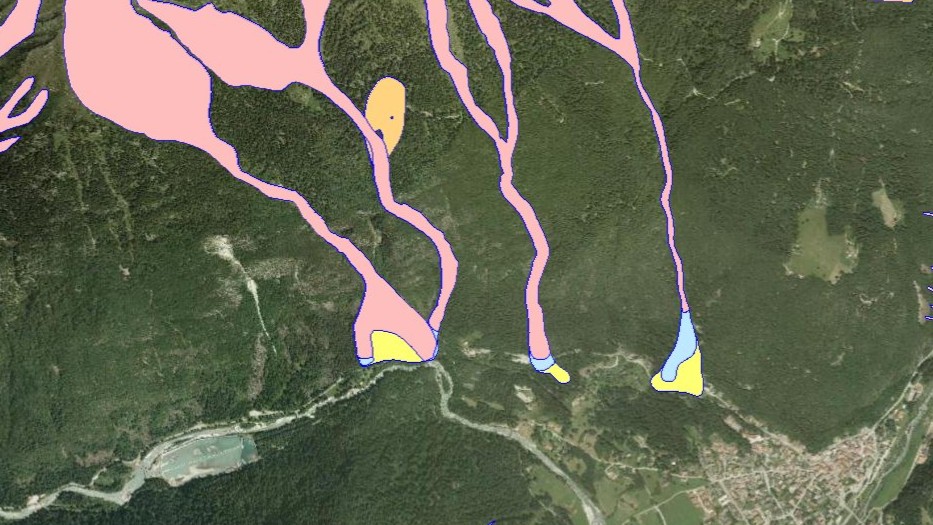
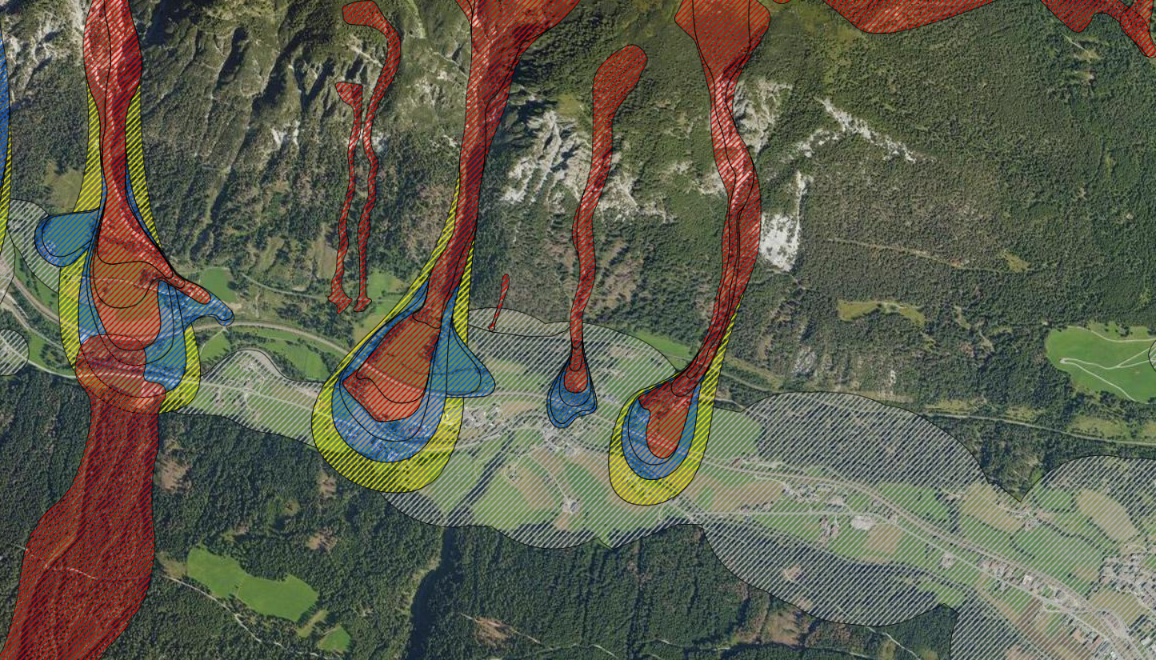
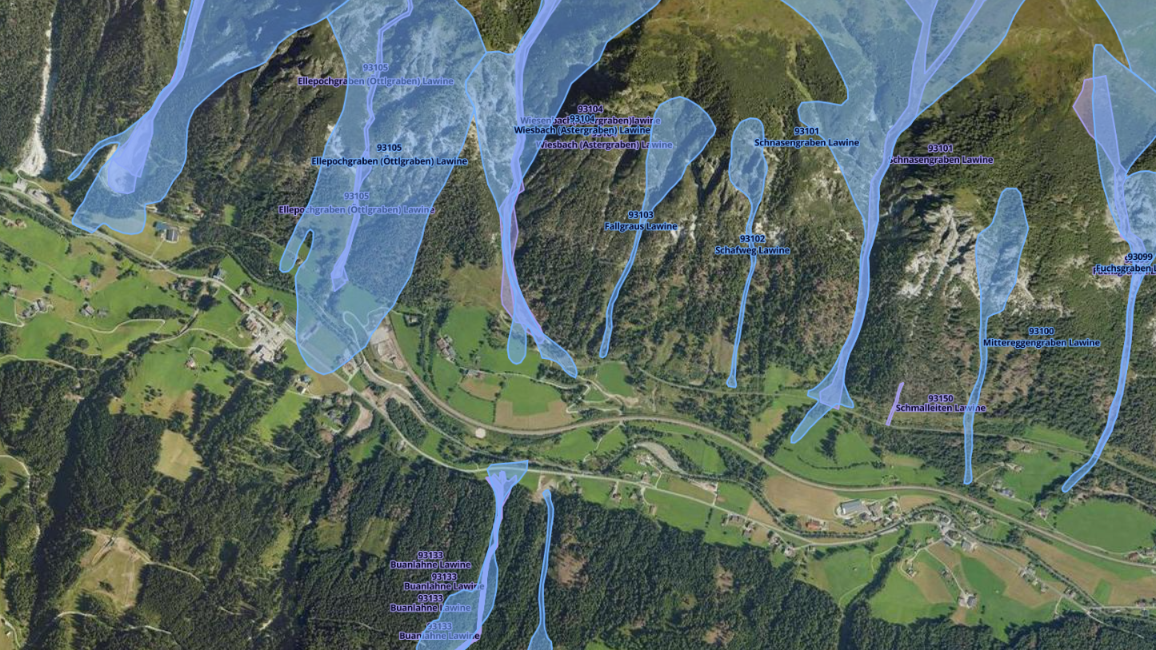
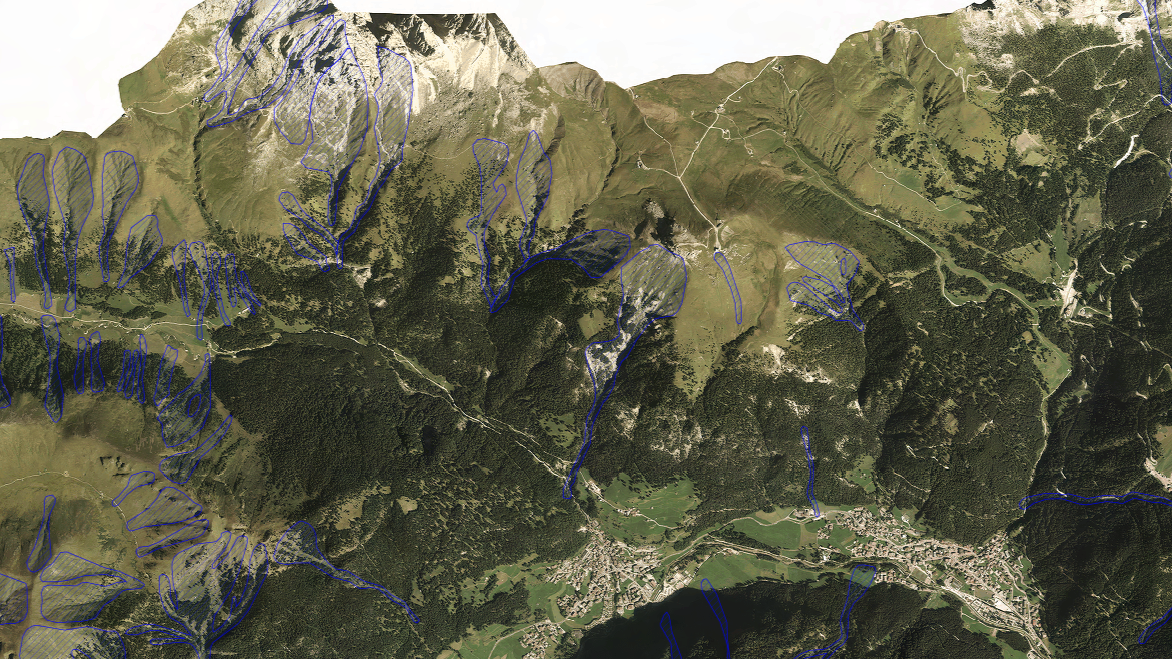
Different looks of the HZP