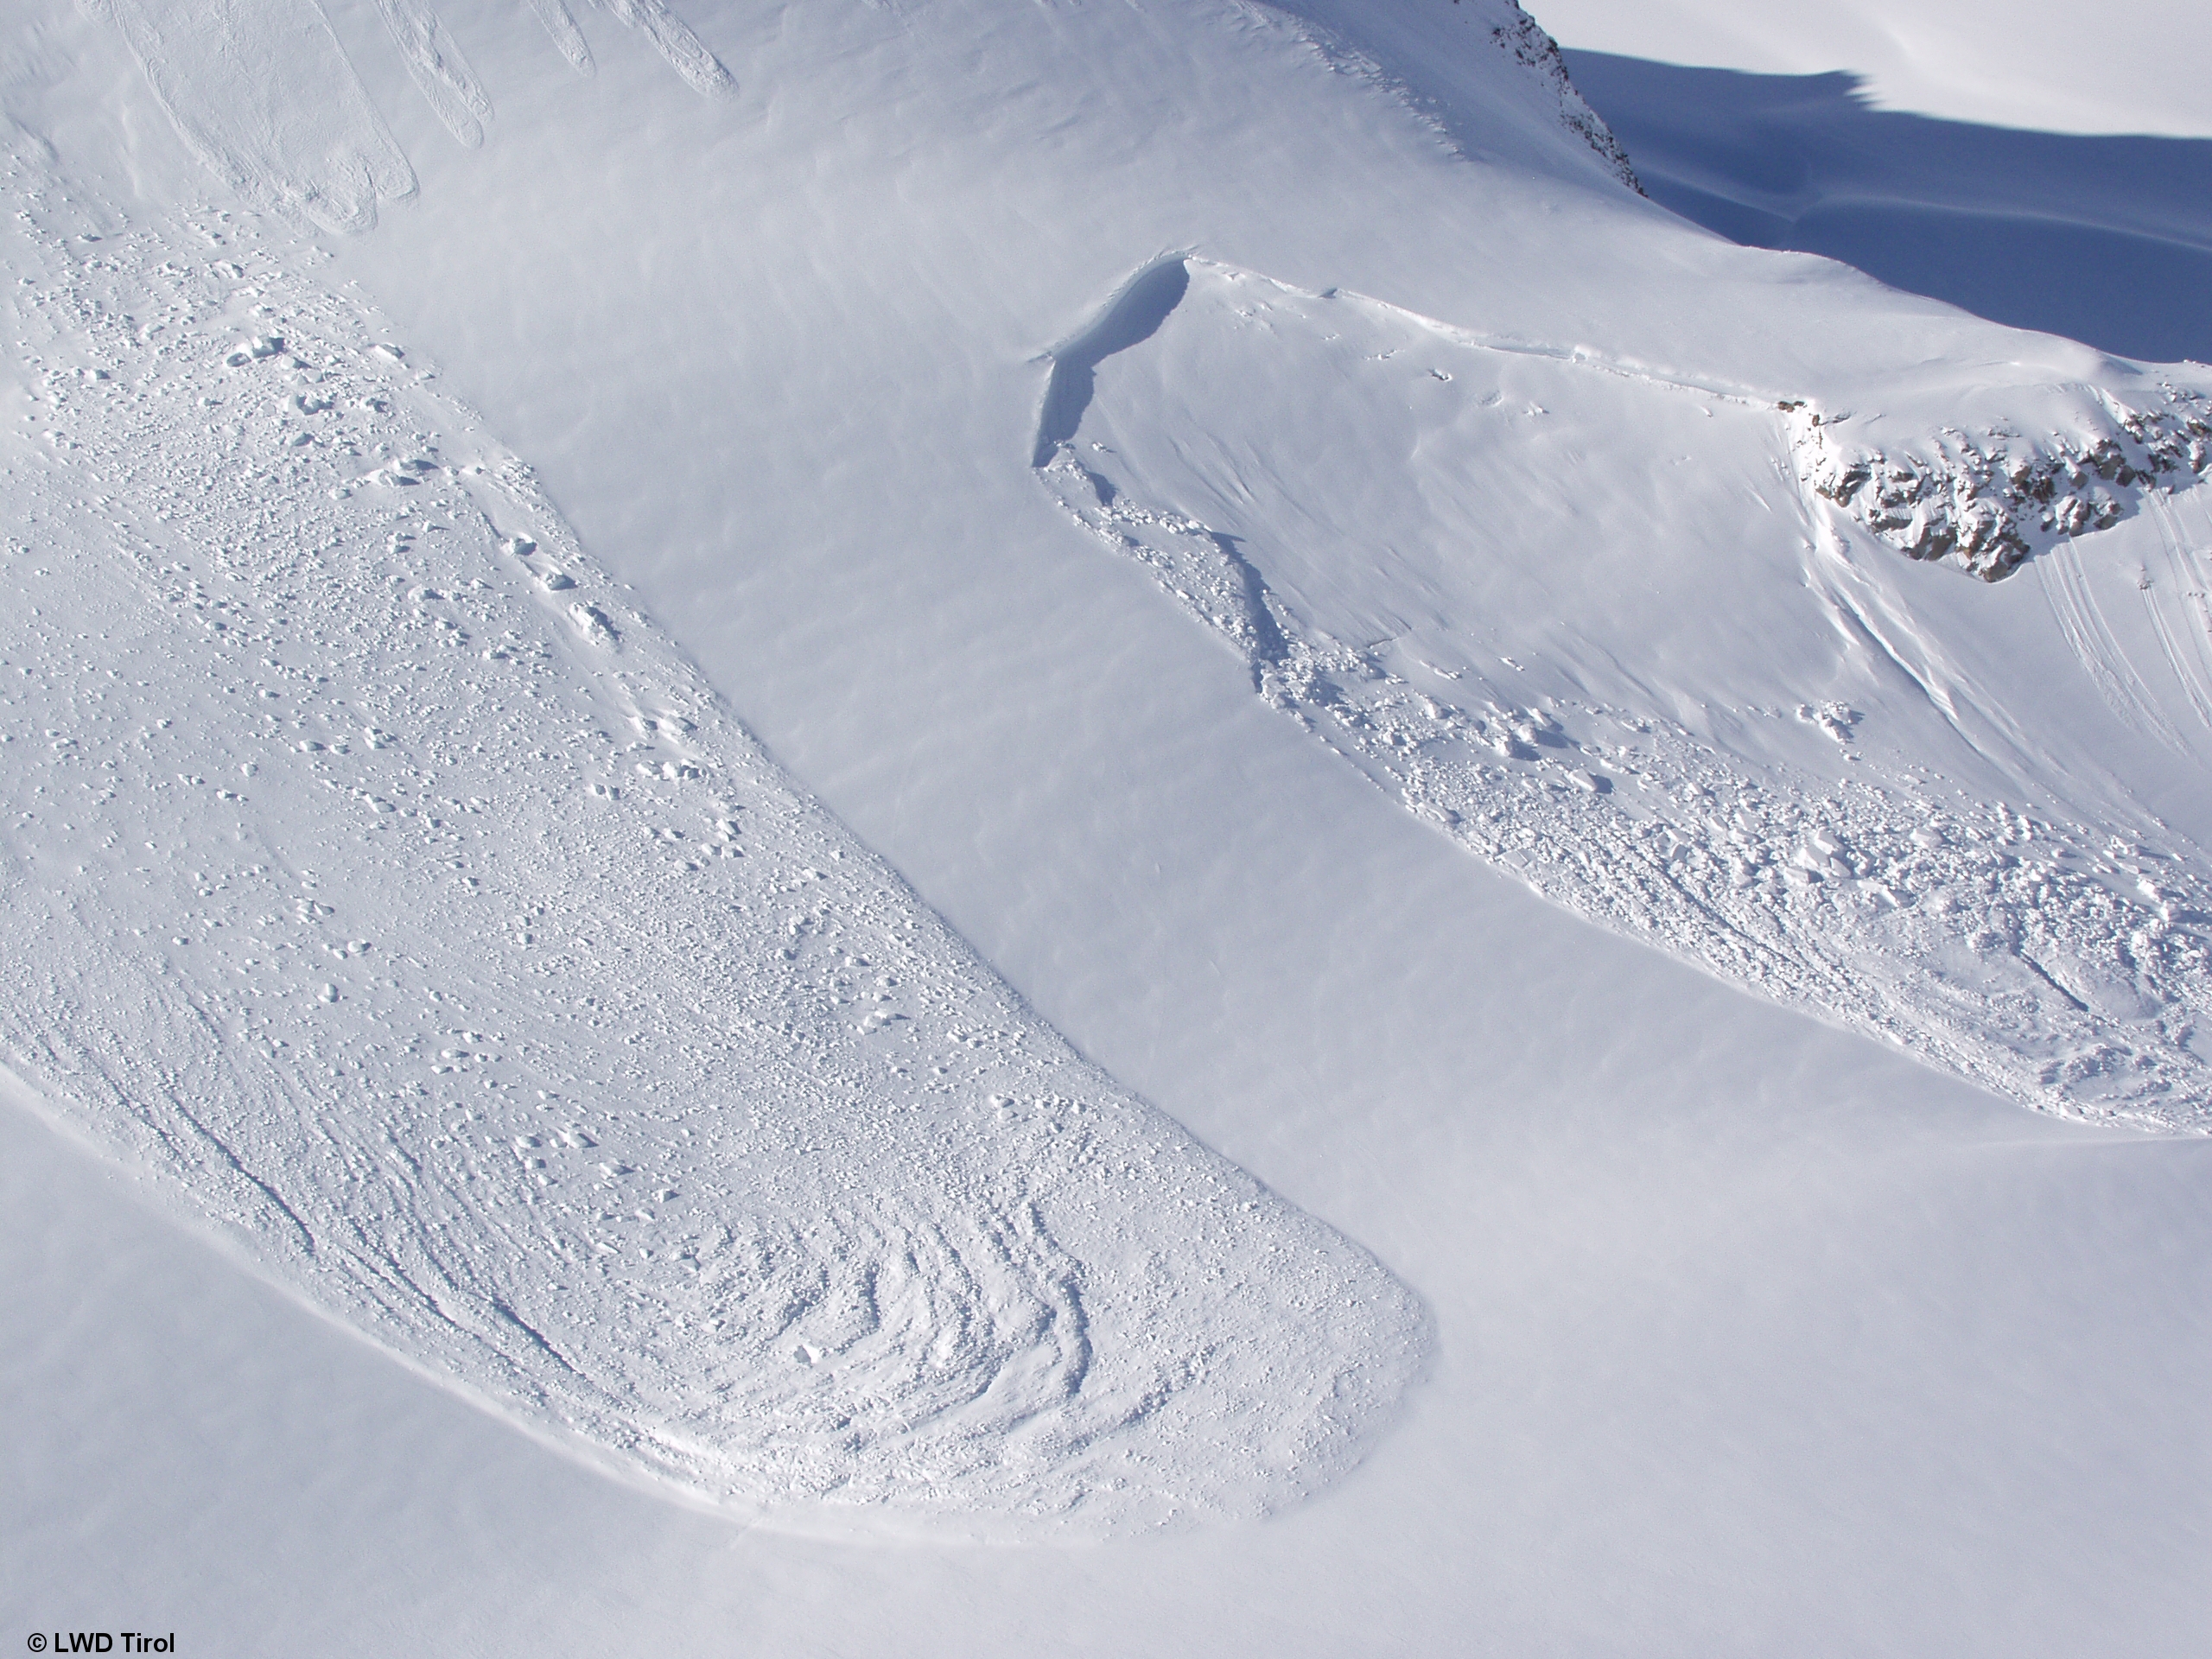
Avalanche basics: avalanche types and trigger factors
Humans have been exposed to the danger of avalanches ever since the Alpine habitat was colonized. Avalanches are gravity-driven mass movements that pose a potential danger as a result of
26.06.2023
Orientation is the ability to find your way around the terrain. This means that you know both where you are and where you need to go. With good visibility and knowledge of the terrain, you “only” need a good overview of the terrain for orientation when freeriding or ski touring. Attention! Of course, this does not mean that you should do without the various map and navigation apps – on the contrary! However, intelligent products also need intelligent users. Users need to know which information can be displayed particularly well in the app and which information is better obtained directly from the terrain.
In contrast to thematic maps such as ski area or road maps, topographic maps contain all the detailed information on a specific area. They depict the terrain (topography) of the earth’s surface and its natural and artificial cover. Settlements, traffic routes, bodies of water, ground cover, boundaries and relief forms and other features that are necessary for orientation are shown on topographic maps and explained with labels. All objects are depicted correctly and completely in accordance with the map scale. Topographic maps therefore allow a very good assessment of the terrain. This means that they can be used to obtain information on elevation, steepness, exposure and surface shapes. However, a topographic map is more or less difficult to read, i.e. to bring into line with reality, depending on how it is made.
Topographical maps have a scale of between 1:25,000 and 1:100,000, whereas hiking and ski tour maps usually have a scale of 1:25,000 or 1:50,000. This means that 1 cm on the map corresponds to 25,000 cm, i.e. 250 m in reality.
The overview boards/piste maps of ski areas are thematic maps. These boards give a great and abstract – and therefore easy to grasp – overview of how a ski area is structured, where which run or variant leads, where the lift stations and huts are located, what the surrounding peaks/valleys are called, etc. It’s a great idea to take a folder that is often displayed on such boards, especially as the most important telephone numbers for emergencies and other information are also printed there.

In many freeride areas, up-to-date information on the avalanche situation, snow conditions, temperature, etc. can also be found on or next to overview boards. The boards are ideal as meeting points and provide an opportunity to discuss the next run or the plan for the day with all group members and, for example, to point out the local conditions (area names, trenches you can’t get out of, etc.) to newcomers to the area.
Digital maps offer an ideal compromise between detailed representation and practicality. In contrast to any paper map, the location can be determined very accurately at any time (as long as the signals from at least four GPS satellites are received). In combination with the various map layers, which provide information on steepness, exposure etc., and the possibility of 3D representations, it is quite easy to transfer this location to the real terrain and prepare for the further descent. Last but not least, the rather banal zoom function helps many people to get a rough overview of the entire area. It is also a good aid for small-scale decisions (e.g. What is below me? Can I get any further here or is there an insurmountable ledge?) The fact that specific layers, e.g. showing quiet zones, wildlife reserves etc., provide more information than can be seen with the naked eye in nature is only mentioned in passing. A real added value!
When freeriding, a classic paper map is useful to get an overview of the entire area. However, digital maps are much better for planning specific tours or descents or as an orientation aid in the terrain. Tour portals or map apps help you to plan quickly and accurately. They also give you a good idea of the expected terrain and possible obstacles.
Thanks to the option of downloading the maps and using them offline, they can also be used for navigation in the field without network reception. Ideally, you should also download the exact track of the planned route. This is particularly advisable in terms of battery drain – because offline maps can also be used in flight mode, which extends the battery life enormously (which in turn is very essential in an emergency).
Nevertheless, the basics of reading and correctly interpreting topographical maps must be mastered. Even the best app is of little use if the user cannot understand and classify the information. The best possible digital use of topographic maps in apps requires background knowledge, and it must also be possible to assess the data basis and type of representation (up-to-dateness, resolution, reliability, etc.). This knowledge and the best possible use of digital maps can be acquired by working with them. Compare different maps with each other, try out what each map can do and how to use the individual functions.
In fact, there are only a few map apps that are ideal for freeriding – and then usually only in the paid version.
It is advisable to decide on a map app – preferably with the whole group of friends – and to communicate via this app during planning (send planned lines, ask for comments, discuss equipment, etc.). Only if a map app is used regularly and constantly updated can it be used reliably in planning and in the terrain. Downloading the required map data for offline use with the desired layers, route data, etc. is not always easy and requires a certain routine.
There are various tutorials for the different apps in which the functions and limitations are well described. Almost all high-quality map apps are able to display the following information:
Contour lines (isohypses) allow a relatively accurate assessment of the terrain. They provide information about the absolute height, the slope orientation (exposition), the shape of the terrain and the steepness. In some cases, the surface characteristics (rock, forest, meadow, etc.) can also be read from them if the lines are colored accordingly. While the absolute height can be read very easily from the contour lines, determining the exposure is not so simple.
It should be possible to roughly estimate the altitude and exposure even without a smartphone. A good guide for this is the tree line, which in the European Alps is approximately 1,800 m above sea level. Individual trees can also grow up to 2,000 or even 2,200 m (= tree line).
The exposure or slope orientation describes the direction in which a slope faces. North-facing slopes face north and are completely shaded during the winter months. On (steep) south-facing slopes, on the other hand, solar radiation is particularly intense. In late winter, these are particularly susceptible to heavy soaking and the resulting wet snow avalanches. Map layers can also be useful for determining the slope exposure – however, every winter sports enthusiast should be able to determine this independently in the terrain.
The easiest way to determine exposure is by the position of the sun. While eastern slopes get sun in the morning, western slopes are only exposed at the end of the day. South-facing slopes are mainly exposed at midday, while north-facing slopes receive practically no sun at all throughout the winter.
This layer in a digital map provides information about the steepness of the terrain. The slope gradient is shown in color on the map – the darker the color, the steeper the slope. Terrain with a slope gradient of less than 30 degrees is usually not colored.
In order to obtain the most accurate information possible about the surface conditions, it is possible to display a satellite image as a map layer. It often makes orientation easier thanks to landmarks such as isolated trees or rocks and can often be helpful when freeriding, e.g. to better assess the vegetation.
When talking about 3D maps, there is no getting around Fatmap. No other digital map provides such an accurate and realistic view of the terrain. Descents and gullies can be precisely explored in advance – possible steep steps and terrain traps can often be better recognized in this way than on topographical maps. The terrain is extremely realistic in a 3D representation combined with a satellite image and makes it possible to inspect difficult sections of terrain precisely in order to get a better idea of them.
Some map providers also offer special avalanche terrain maps. These are generated in a much more complex way (and are based on calculation models) and are extremely valuable for freeriders. “Skitourenguru” and “White Risk” offer such map layers, which not only include the slope gradient, but also the terrain shape, surface characteristics, slope size, etc. and also display additional information such as typical starting zones, run-out zones or areas for remote triggering.
The following topic-specific layers are already partially displayed in certain apps or for selected areas, whereby an expansion to other areas or a broader use in various apps is to be expected:
Depending on the app/region, automatically generated or manually defined representation of the three classes in the “Avalanche Terrain Exposure Scale”. The “Avalanche Terrain Exposure Scale” (ATES) from Parks Canada classifies the terrain – and not the snow layering – in terms of potential avalanche danger. Corresponding terrain maps are common in North America and are also slowly becoming more widespread in the Alpine region. They are ideal for classifying the avalanche risk in open terrain into the following three categories at a glance:
Relevant parameters such as slope inclination/shape, forest cover, terrain traps, avalanche probability/year, characteristics of the avalanche start/deposition zone and avalanche path, route alternatives, exposure time and glaciation are defined in a detailed technical table, but also in a simple version for the general public. More details can be found here.
The “Classified Avalanche Terrain” (CAT) map divides the avalanche terrain thematically into starting zones in red and run-out zones in blue and yellow. Red shows the potential starting zone between 30 and 50 degrees slope gradient. The darker the red color, the more likely an avalanche is to start. The potential run-out area is colored in three shades of blue and yellow. The darker the blue, the more likely is a remote triggering in the event of an unfavorable snowpack build-up (typical for persistent weak layers). The yellow color shows the possible runout of a large (size 3), dry slab avalanche with an average avalanche depth of 50 cm.
The “Avalanche Terrain Hazard” (ATH) map shows how dangerous the terrain generally is in terms of avalanches. It combines the potential for avalanche initiation and remote triggering with the possible consequences of burial or falling. The layer consists of continuous values that are displayed using a color gradient. The higher the value, the more dangerous the terrain is in terms of avalanches. In contrast to the CAT map, no thematic distinction can be made here between avalanche start and run-out areas.

Humans have been exposed to the danger of avalanches ever since the Alpine habitat was colonized. Avalanches are gravity-driven mass movements that pose a potential danger as a result of
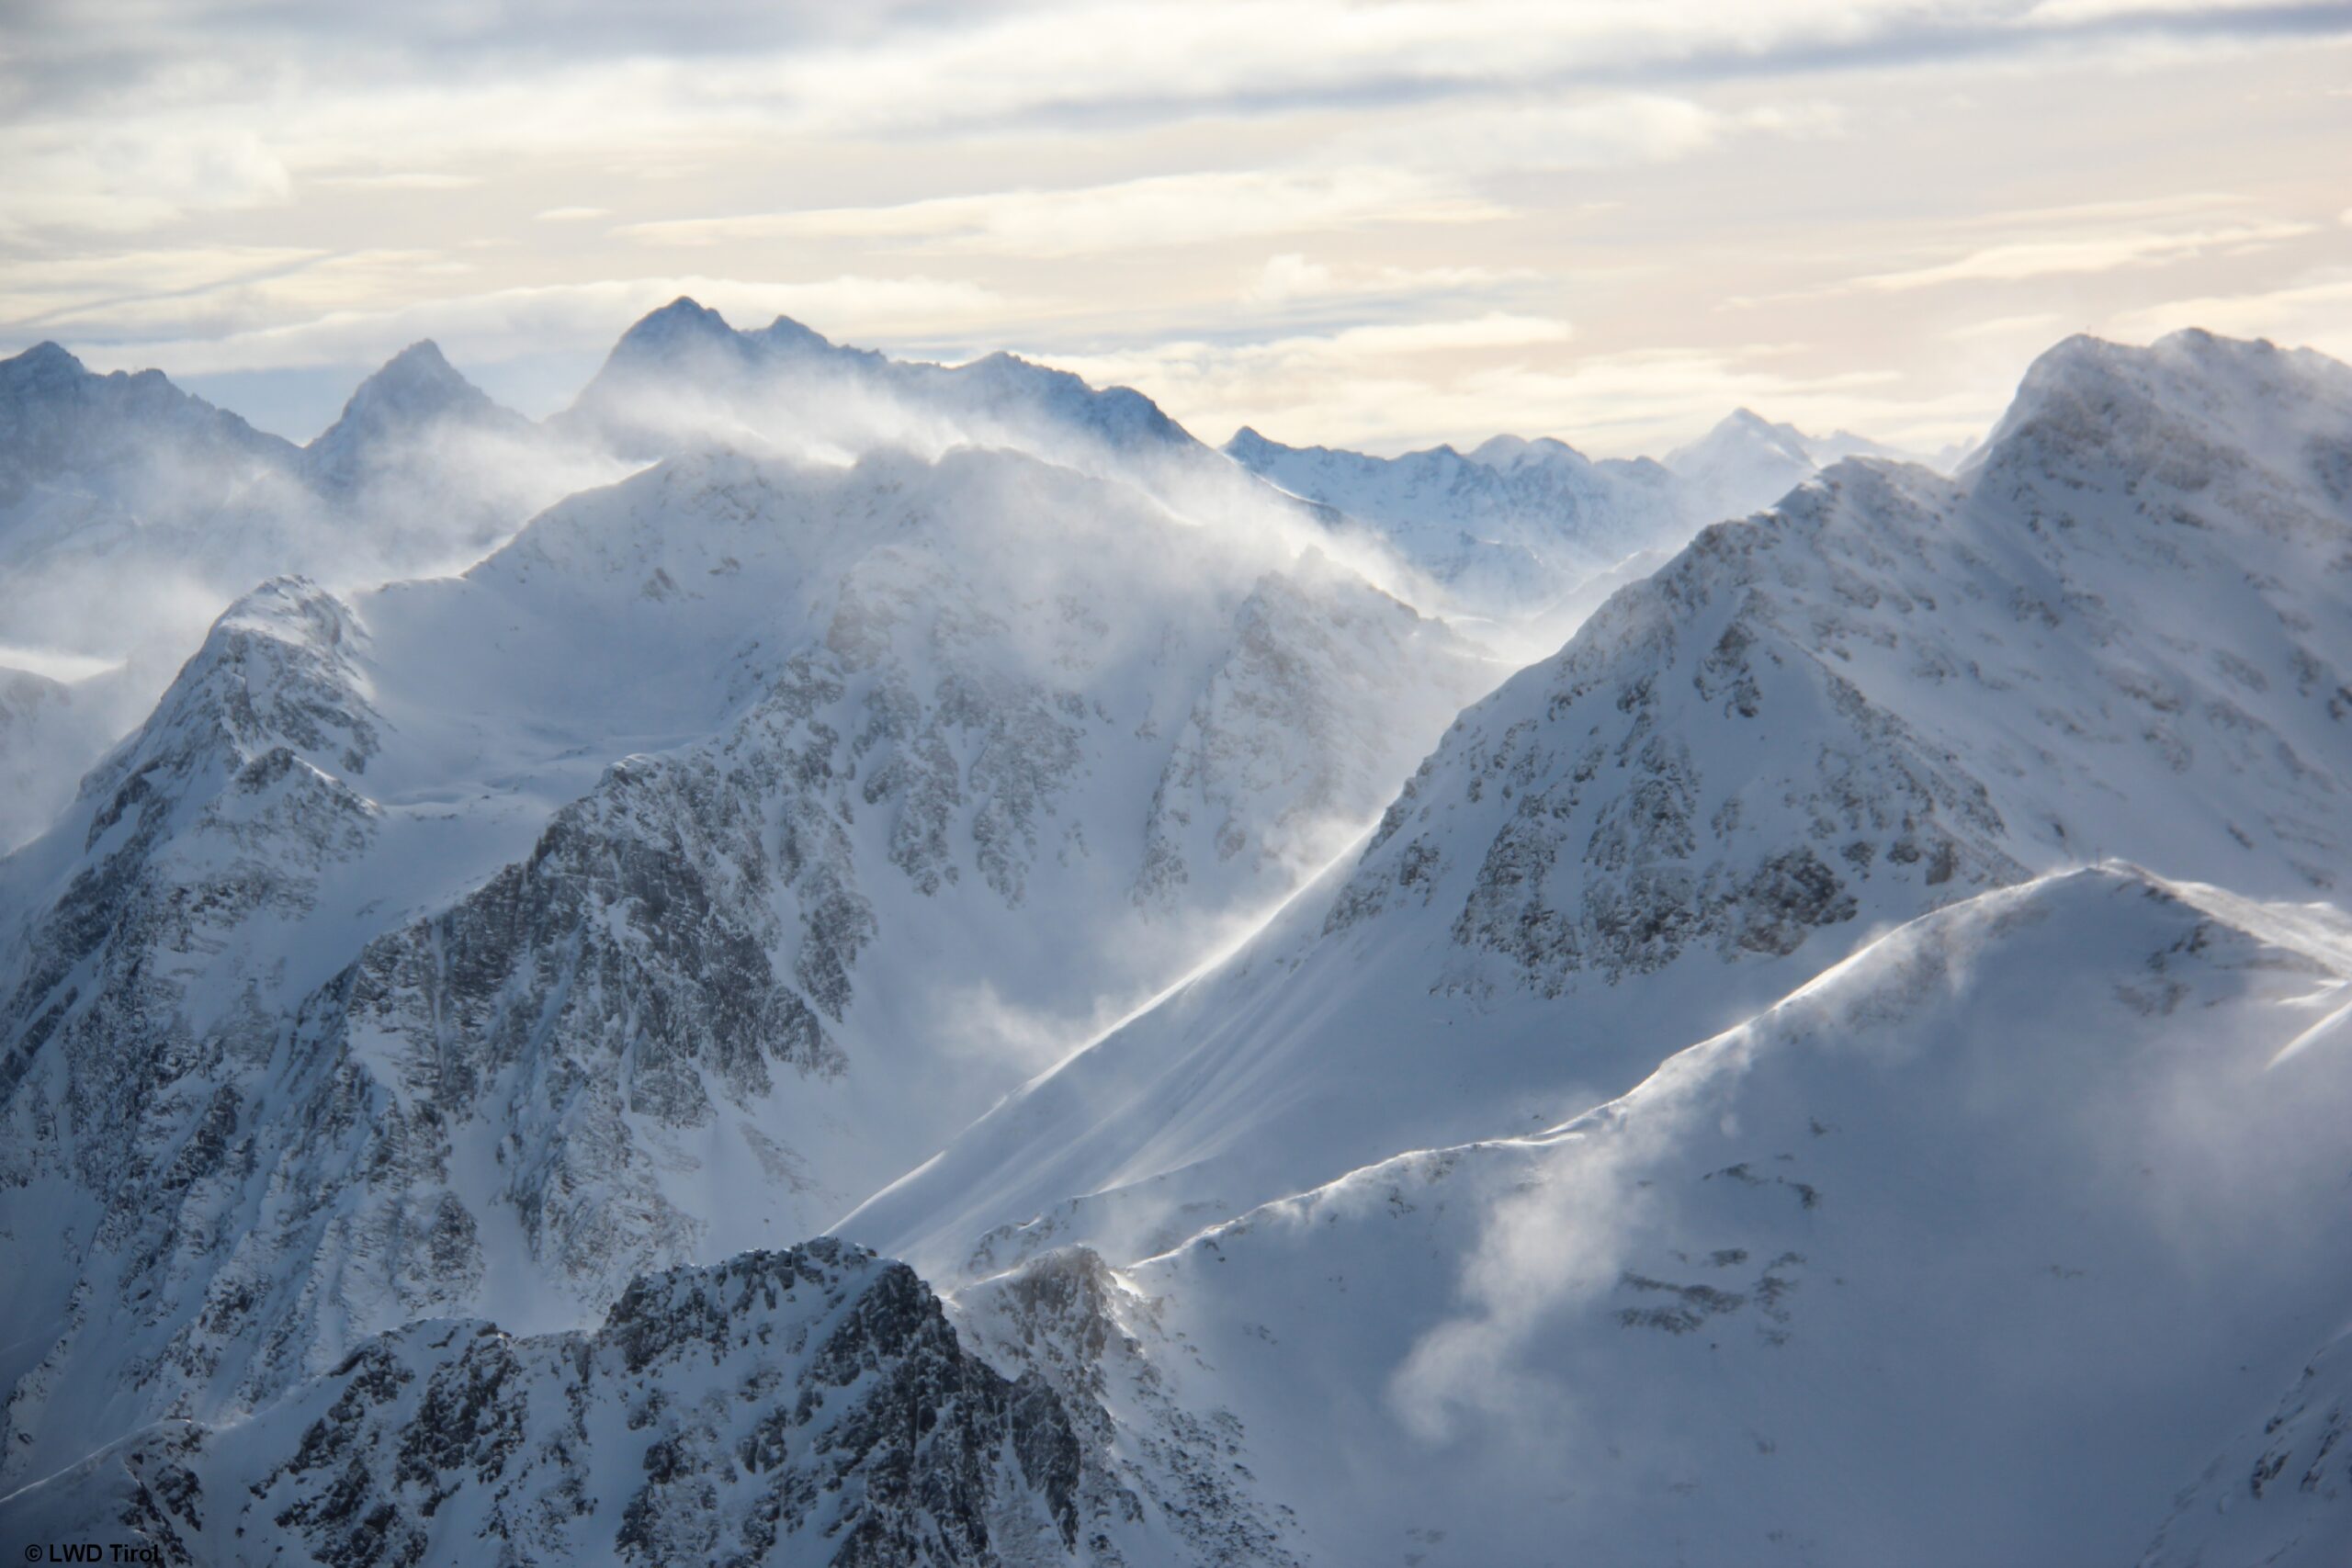
In order to be safe in the mountains, a sound knowledge of the weather and the most common terms in the weather forecast are essential.
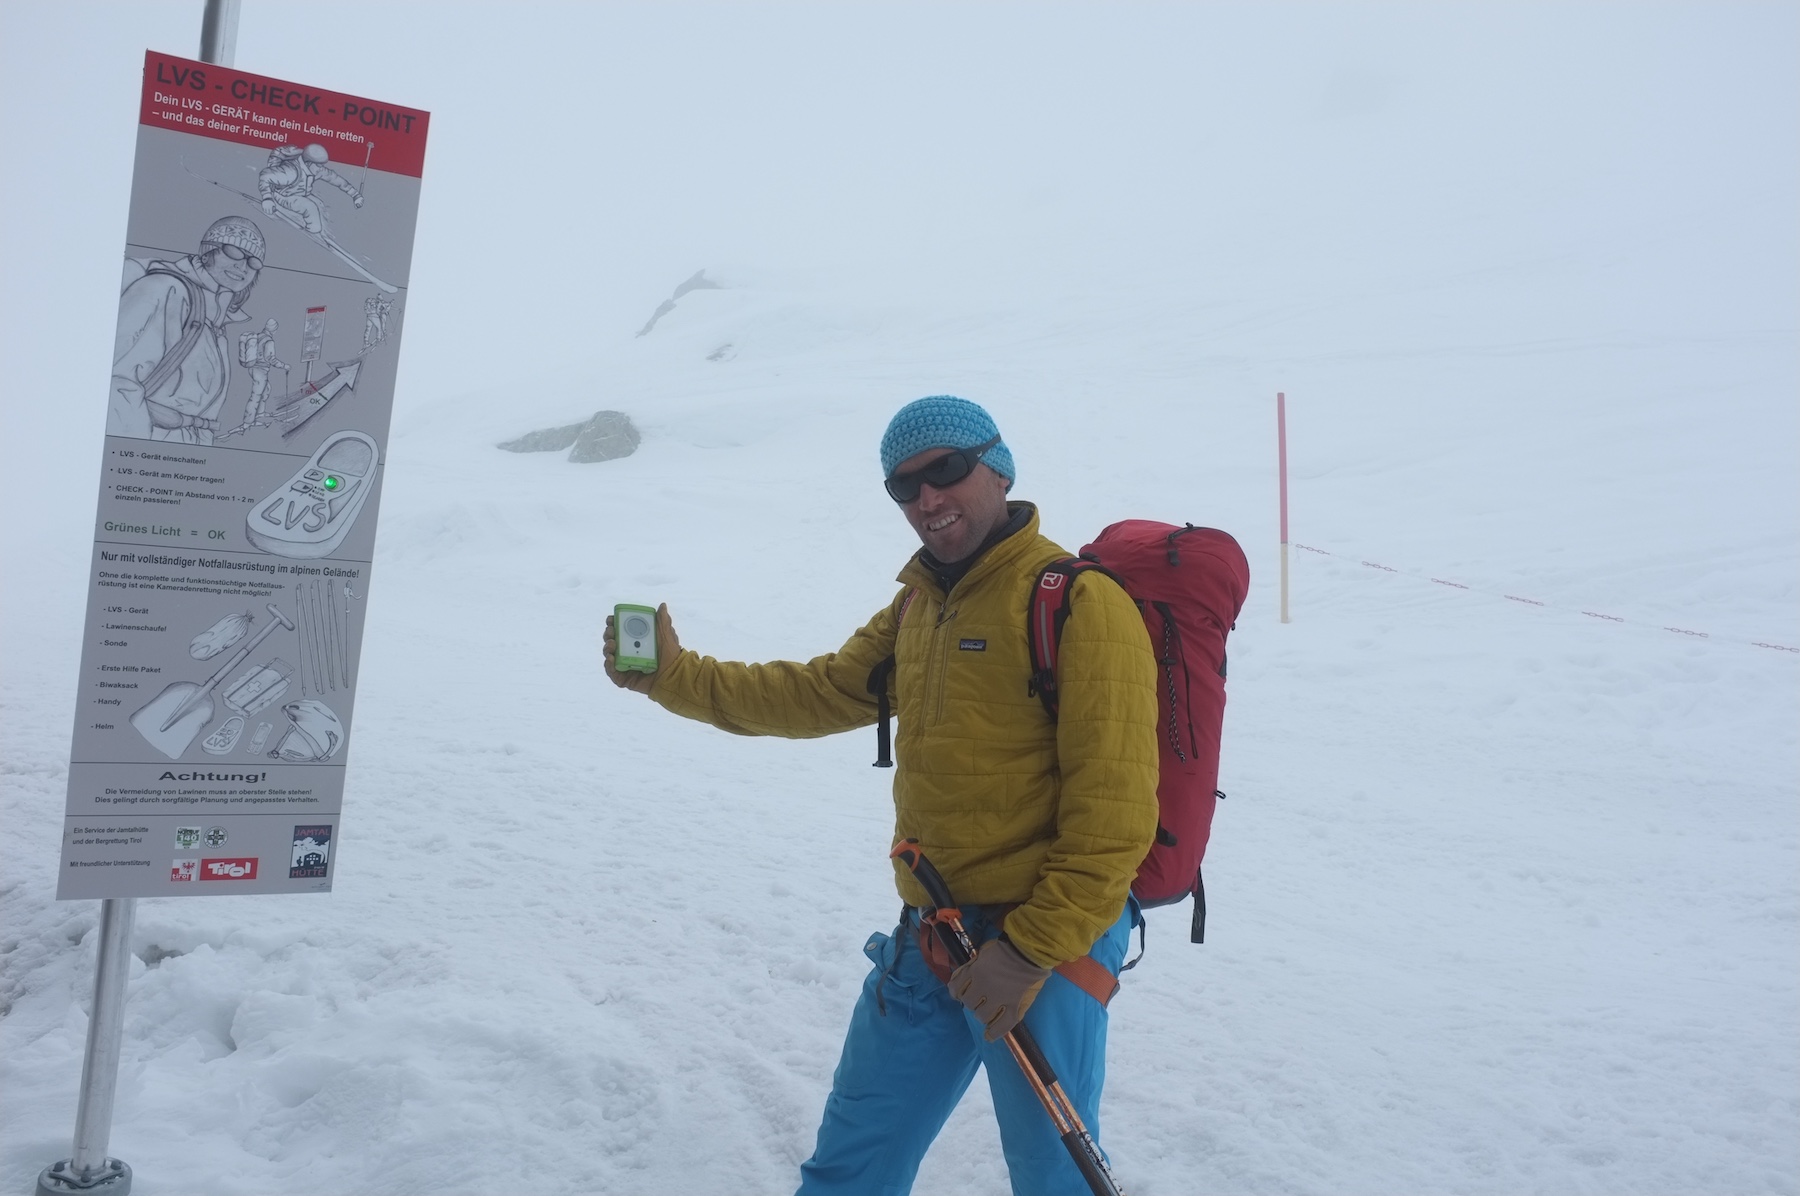
“Do you think I need a new avalanche transceiver?” is a question often asked by freeriders and course participants. Those who ask this question usually know themselves that the answer

Humans have been exposed to the danger of avalanches ever since the Alpine habitat was colonized. Avalanches are gravity-driven mass movements that pose a potential danger as a result of

The typical skier avalanche is around 50-70 meters wide and has about three times the flow length. The fracture depth (also called break-off depth) is on average around half a

As soon as the first snow falls, the motto is: grab your skis or board and make the first tracks of the season in the snow on the glacier or in the backcountry. Those who
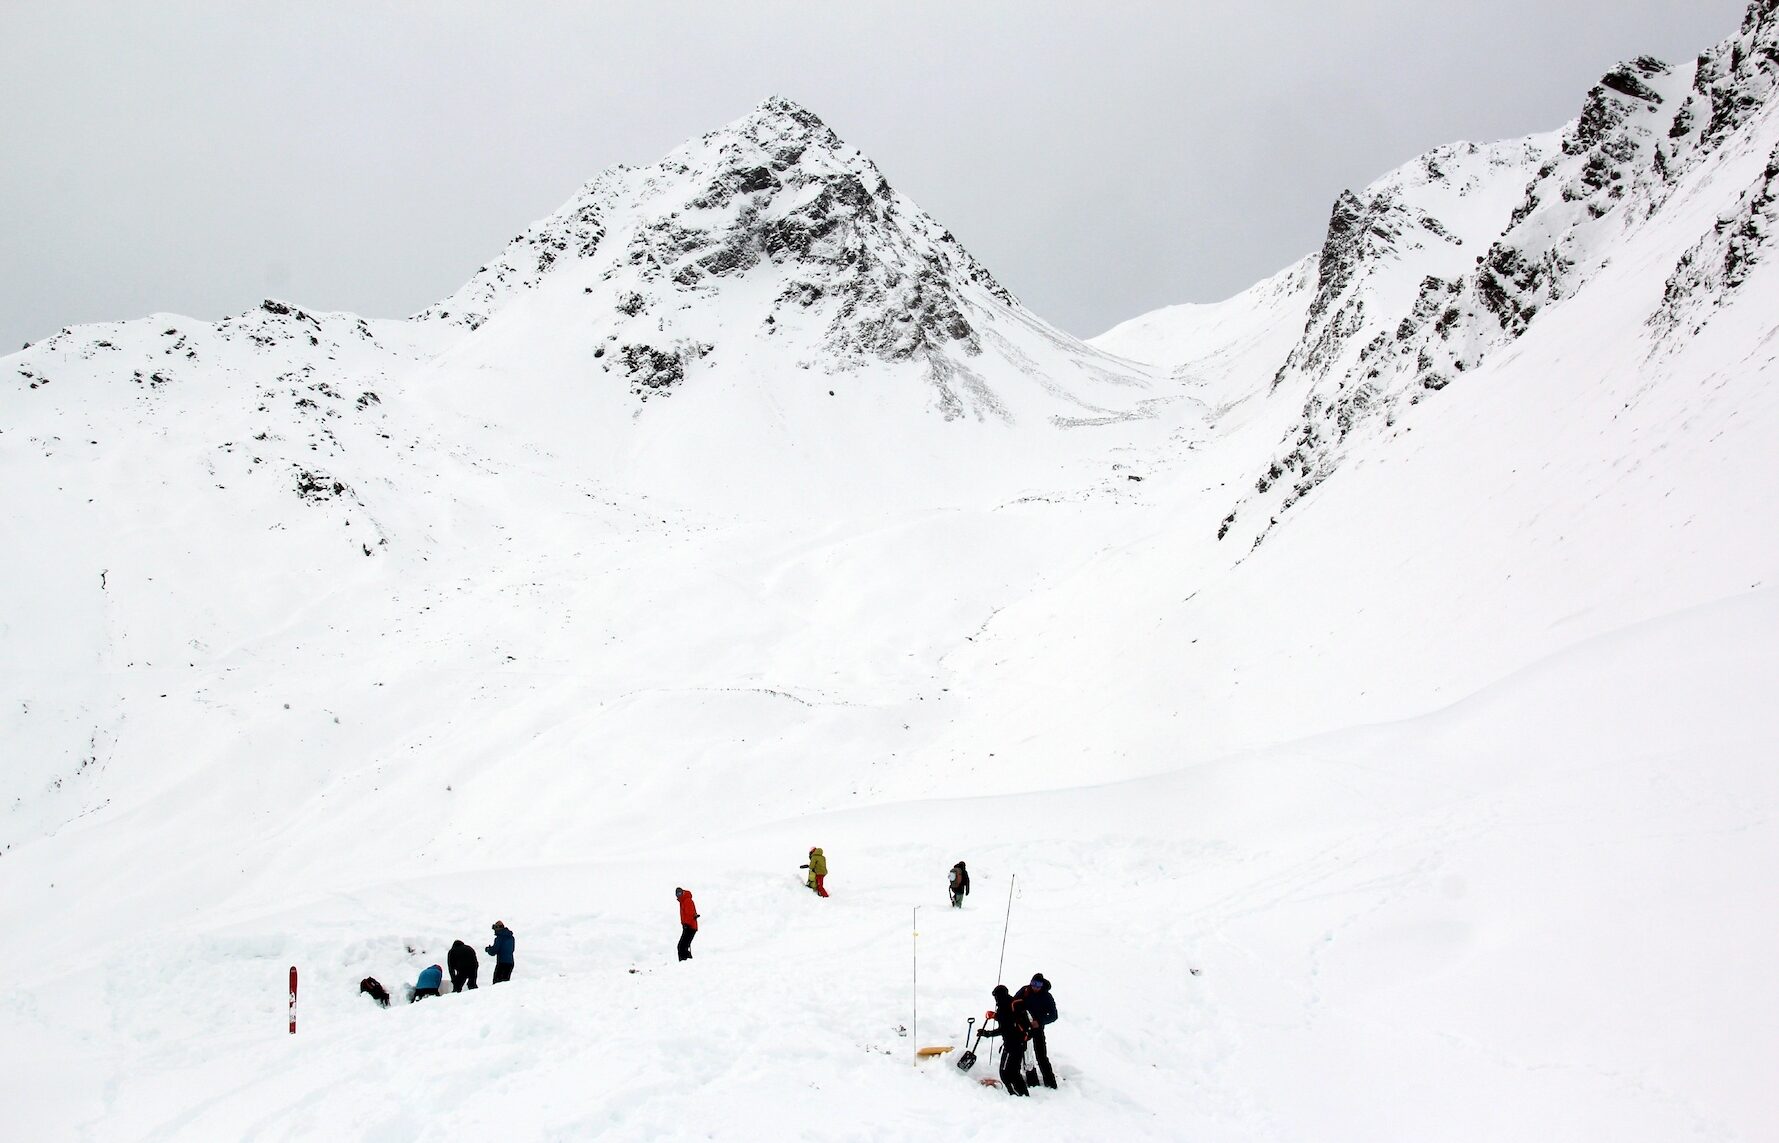
More than half of all people involved in avalanche incidents suffer no or only minor injuries. Around 32 percent of the people involved are seriously injured, and the death rate of people who are buried (regardless of the burial depth) is around 13 percent.

Snow is a form of frozen water. It consists of many small ice crystals that form into snowflakes.
Topics
Legal information
All graphics, images and texts on the entire site may be downloaded and used in accordance with our rights of use.